Avon 2000 Annual Report Download - page 2
Download and view the complete annual report
Please find page 2 of the 2000 Avon annual report below. You can navigate through the pages in the report by either clicking on the pages listed below, or by using the keyword search tool below to find specific information within the annual report.
32
Contents
33 Management’s
Discussion & Analysis
33 Cautionary Statement
33 Results of Operations
33 Consolidated
36 2000 Compared to 1999
North America
International
38 1999 Compared to 1998
North America
International
39 Global Expenses
40 Accounting Changes
40 Contingencies
40 Liquidity and Capital
Resources
40 Cash Flows
40 Working Capital
41 Capital Resources
42 Inventories
42 Capital Expenditures
42 Foreign Operations
44 Risk Management Strategies
and Market Rate Sensitive
Instruments
45 Other Information
45 Euro
46 Results of Operations
by Quarter
47 Market Prices Per Share of
Common Stock by Quarter
48 Consolidated Statements
of Income
49 Consolidated Balance Sheets
50 Consolidated Statements
of Cash Flows
51 Consolidated Statements
of Changes in Shareholders’
(Deficit) Equity
52 Notes to Consolidated
Financial Statements
69 Report of Management and
Report of Independent
Auditors
70 Eleven-Year Review
FINANCIAL SECTION
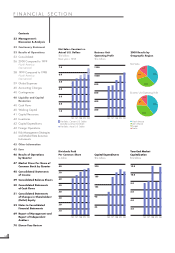
Net Sales–Constant vs.
Actual U.S. Dollars
$ In billions
Base year = 1996
1.0
2.0
3.0
4.0
5.0
6.0
7.0
96 97 98 99 00
Net Sales, Constant U.S. Dollars
(excludes currency translation)
■Net Sales, Actual U.S. Dollars
Business Unit
Operating Profit
$ In millions
200
400
600
800
1000
1200
96 97 98 99 00
2000 Results by
Geographic Region
■North America
■Latin America
■Europe
■Pacific
Net Sales
Business Unit Operating Profit
38%
32%
16%
14%
36%
40%
13%
11%
Dividends Paid
Per Common Share
In dollars
.10
.20
.30
.40
.50
.60
.70
.80
96 97 98 99 00
Capital Expenditures
$ In millions
45
90
135
180
225
96 97 98 99 00
Year-End Market
Capitalization
$ In billions
2.0
4.0
6.0
8.0
10.0
12.0
96 97 98 99 00


