Avon 2000 Annual Report Download - page 3
Download and view the complete annual report
Please find page 3 of the 2000 Avon annual report below. You can navigate through the pages in the report by either clicking on the pages listed below, or by using the keyword search tool below to find specific information within the annual report.-
 1
1 -
 2
2 -
 3
3 -
 4
4 -
 5
5 -
 6
6 -
 7
7 -
 8
8 -
 9
9 -
 10
10 -
 11
11 -
 12
12 -
 13
13 -
 14
14 -
15
-
16
-
17
-
18
-
19
-
20
-
21
-
22
-
23
-
24
-
25
-
26
-
27
-
28
-
29
-
30
-
31
-
32
-
33
-
34
-
35
-
36
-
37
-
38
-
39
-
40
-
41
-
42
-
43
 |
 |

33
The following discussion of the results of operations and
financial condition of Avon Products, Inc. (“Avon” or the
“Company”) should be read in conjunction with the infor-
mation contained in the Consolidated Financial Statements
and Notes thereto. These statements have been prepared
in conformity with generally accepted accounting princi-
ples which require management to make estimates and
assumptions that affect amounts reported and disclosed in
the financial statements and related notes. Actual results
could differ from these estimates.
Cautionary Statement for Purposes of the “Safe
Harbor” Statement Under the Private Securities
Litigation Reform Act of 1995
Certain statements in this report which are not historical
facts or information are forward-looking statements
within the meaning of the Private Securities Litigation
Reform Act of 1995, including, but not limited to, the
information set forth herein. Such forward-looking state-
ments involve known and unknown risks, uncertainties
and other factors which may cause the actual results,
levels of activity, performance or achievement of the
Company, or industry results, to be materially different
from any future results, levels of activity, performance
or achievement expressed or implied by such forward-
looking statements. Such factors include, among others,
the following: General economic and business conditions;
the ability of the Company to implement its business
strategy; the Company’s access to financing and its man-
agement of foreign currency risks; the Company’s ability
to successfully identify new business opportunities; the
Company’s ability to attract and retain key executives; the
Company’s ability to achieve anticipated cost savings and
profitability targets; the impact of substantial currency
exchange devaluations in the Company’s principal foreign
markets; changes in the industry; competition; the effect
of regulatory and legal restrictions imposed by foreign
governments; the effect of regulatory and legal proceed-
ings and other factors discussed in Item 1of the Company’s
Form 10-k. As a result of the foregoing and other factors,
no assurance can be given as to the future results and
achievements of the Company. Neither the Company nor
any other person assumes responsibility for the accuracy
and completeness of these statements.
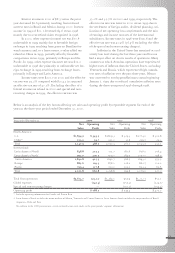
Results of Operations
Consolidated > Net income in 2000 was $478.4 com-
pared with $302.4 in 1999. Basic and diluted earnings
per share in 2000 were $2.01 and $1.99, respectively,
compared with $1.18 and $1.17, respectively, in 1999.
Net income for 1998 was $270.0 and basic and diluted
earnings per share were $1.03 and $1.02, respectively.
Effective January 1, 2000, the Company changed
its method of accounting for revenue recognition in accor-
dance with Staff Accounting Bulletin (“sab”) No. 101,
“Revenue Recognition in Financial Statements.” See Note
2of the Notes to Consolidated Financial Statements. The
cumulative effect of the change on prior years resulted in
a charge of $6.7, net of a tax benefit of $3.5, or $.03 per
share on a basic and diluted basis, which is included in
net income for the year ended December 31, 2000. The
effect of the accounting change in 2000 was to decrease
net income before the cumulative effect of the accounting
change by $1.1.
In addition, the 2000 results include the settlement
of a federal income tax refund, which was received in
January 2001, consisting of $32.5 of tax and $62.7 of
interest related to the years ended December 31, 1982,
1983, 1985 and 1986. For the year ended December 31,
2000, the Company recognized $40.1 ($.17 and $.16 per
share on a basic and diluted basis, respectively) as an income
tax benefit in the Consolidated Statements of Income,
resulting from the impact of the tax refund offset by taxes
due on interest received and other related tax obligations.
Special and non-recurring charges were recorded
in the first quarter of 1999 for the Company’s business
process redesign (“bpr”) program. These charges totaled
$151.2 pretax, which reduced net income by $121.9 after
tax, or $.47 per share on a basic and diluted basis. The
1998 results include special and non-recurring charges
totaling $154.4 pretax, which reduced net income by
$122.8 after tax, or $.46 per share on a basic and diluted
basis. See Note 13 of the Notes to Consolidated Financial
Statements for further discussion of this program.
Before special and non-recurring charges in 1999,
earnings per share of $1.65 and $1.64 on a basic and
diluted basis, respectively, both increased 11% over the
comparable period in 1998.
Management’s Discussion and Analysis
Avon Products, Inc.
Dollars in millions, except share data