Abercrombie & Fitch 2008 Annual Report Download - page 79
Download and view the complete annual report
Please find page 79 of the 2008 Abercrombie & Fitch annual report below. You can navigate through the pages in the report by either clicking on the pages listed below, or by using the keyword search tool below to find specific information within the annual report.-
 1
1 -
2
-
3
-
4
-
5
-
6
-
7
-
8
-
9
-
10
-
11
-
12
-
13
-
14
-
15
-
16
-
17
-
18
-
19
-
20
-
21
-
22
-
23
-
24
-
25
-
26
-
27
-
28
-
29
-
30
-
31
-
32
-
33
-
34
-
35
-
36
-
37
-
38
-
39
-
40
-
41
-
42
-
43
-
44
-
45
-
46
-
47
-
48
-
49
-
50
-
51
-
52
-
53
-
54
-
55
-
56
-
57
-
58
-
59
-
60
-
61
-
62
-
63
-
64
-
65
-
66
-
67
-
68
-
 69
69 -
 70
70 -
 71
71 -
 72
72 -
 73
73 -
 74
74 -
 75
75 -
 76
76 -
 77
77 -
 78
78 -
 79
79 -
 80
80 -
 81
81 -
 82
82 -
 83
83 -
 84
84 -
 85
85 -
 86
86 -
 87
87 -
 88
88 -
 89
89 -
90
-
91
-
92
-
93
-
94
-
95
-
96
-
97
-
98
-
99
-
100
-
101
-
102
-
103
-
104
-
105
-
106
-
107
-
108
-
109
-
110
-
111
-
112
-
113
-
114
-
115
-
116
-
117
-
118
-
119
-
120
-
121
-
122
-
123
-
124
-
125
-
126
-
127
-
128
-
129
-
130
-
131
-
132
-
133
-
134
-
135
-
136
-
137
-
138
-
139
-
140
-
141
-
142
-
143
-
144
-
145
-
146
-
147
-
148
-
149
-
150
-
151
-
152
-
153
-
154
-
155
-
156
-
157
-
158
-
159
-
160
 |
 |

Table of Contents
ABERCROMBIE & FITCH CO.
NOTES TO CONSOLIDATED FINANCIAL STATEMENTS — (Continued)
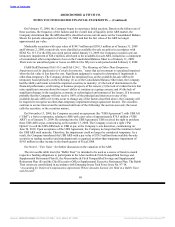
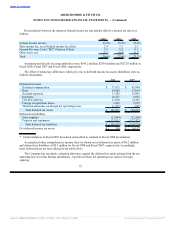
Reconciliation between the statutory federal income tax rate and the effective income tax rate is as
follows:
2008 2007 2006
Federal income tax rate 35.0% 35.0% 35.0%
State income tax, net of federal income tax effect 2.4 3.1 2.3
Internal Revenue Code (“IRC”) Section 162(m) 2.9 0.2 0.1
Other items, net (0.7) (0.9) (0.2)
Total 39.6% 37.4% 37.2%
Amounts paid directly to taxing authorities were $198.2 million, $259.0 million and $272.0 million in
Fiscal 2008, Fiscal 2007 and Fiscal 2006, respectively.
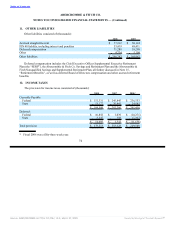
The effect of temporary differences which give rise to deferred income tax assets (liabilities) were as
follows (thousands):
2008 2007*
Deferred tax assets:
Deferred compensation $ 37,635 $ 45,984
Rent 59,809 67,024
Accrued expenses 17,583 15,091
Inventory 10,347 6,691
FIN 48 Liabilities 11,020 12,416
Foreign net operation losses 1,692 2,595
Valuation allowance on foreign net operating losses (1,275) (905)
Total deferred tax assets $ 136,811 $ 148,896
Deferred tax liabilities:
Store supplies (12,844) (12,266)
Property and equipment (123,813) (122,473)
Total deferred tax liabilities $ (136,657) $ (134,739)
Net deferred income tax assets $ 154 $ 14,157
* Certain balances in Fiscal 2007 have been reclassified to conform to Fiscal 2008 presentation.
Accumulated other comprehensive income (loss) is shown net of deferred tax assets of $9.2 million
and deferred tax liabilities of $0.5 million for Fiscal 2008 and Fiscal 2007, respectively. Accordingly,
these deferred taxes are not reflected in the table above.
The Company has recorded a valuation allowance against the deferred tax assets arising from the net
operating loss of certain foreign subsidiaries. A portion of these net operating loss carryovers begin
expiring
75
Source: ABERCROMBIE & FITCH CO /DE/, 10-K, March 27, 2009 Powered by Morningstar® Document Research℠