Abercrombie & Fitch 2008 Annual Report Download - page 27
Download and view the complete annual report
Please find page 27 of the 2008 Abercrombie & Fitch annual report below. You can navigate through the pages in the report by either clicking on the pages listed below, or by using the keyword search tool below to find specific information within the annual report.
Table of Contents
ITEM 7. MANAGEMENT’S DISCUSSION AND ANALYSIS OF FINANCIAL CONDITION AND
RESULTS OF OPERATIONS.
OVERVIEW
The Company’s fiscal year ends on the Saturday closest to January 31, typically resulting in a
fifty-two week year, but occasionally giving rise to an additional week, resulting in a fifty-three week
year. A store is included in comparable store sales when it has been open as the same brand at least one
year and its square footage has not been expanded or reduced by more than 20% within the past year.
Fiscal 2008 and Fiscal 2007 included fifty-two weeks and Fiscal 2006 included fifty-three weeks. For
purposes of this “ITEM 7. MANAGEMENT’S DISCUSSION AND ANALYSIS OF FINANCIAL
CONDITION AND RESULTS OF OPERATIONS,” the thirteen and fifty-two week periods ended
January 31, 2009 are compared to the thirteen and fifty-two week periods ended February 2, 2008. Fiscal
2008 comparable store sales compare the thirteen and fifty-two week periods ended January 31, 2009 to
the thirteen and fifty-two week periods ended February 2, 2008. For Fiscal 2007, the thirteen and fifty-two
week periods ended February 2, 2008 are compared to the fourteen and fifty-three week periods ended
February 3, 2007. Fiscal 2007 comparable store sales compare the thirteen and fifty-two week periods
ended February 2, 2008 to the thirteen and fifty-two week periods ended February 3, 2007.
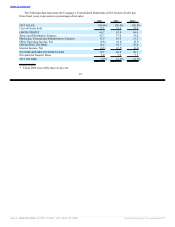
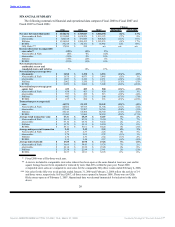
The Company had net sales of $3.540 billion for the fifty-two weeks ended January 31, 2009, down
5.6% from $3.750 billion for the fifty-two weeks ended February 2, 2008. Operating income for Fiscal
2008 was $439.4 million, including a non-cash charge of $30.6 million associated with the impairment of
store-related assets, which was down from $740.5 million in Fiscal 2007. Net income was $272.3 million
in Fiscal 2008, down 42.8% from $475.7 million in Fiscal 2007. Net income per diluted share was $3.05
for Fiscal 2008, compared to $5.20 in Fiscal 2007. Fiscal 2008 net income per diluted share included a
non-cash charge of approximately $0.21 per diluted share associated with the impairment of store-related
assets and a charge to tax expense of approximately $0.11 per diluted share related to the execution of the
Chairman and Chief Executive Officer’s (“CEO”) new employment agreement.
The Company generated cash from operations of $490.8 million in Fiscal 2008 down from
$817.5 million in Fiscal 2007. The decrease resulted primarily from a reduction in net income, the
increase in inventory on-hand in Fiscal 2008, compared to a reduction of inventory on-hand in Fiscal
2007, and a reduction of income taxes and accounts payable. During Fiscal 2008, the Company used cash
from operations to finance its growth strategy, including the opening of two new Abercrombie & Fitch
stores, 66 new Hollister stores, 12 new abercrombie stores, six new RUEHL stores, and 11 new Gilly
Hicks stores, as well as investments in home office resources and infrastructure to support the Company’s
international expansion. The Company also used cash in Fiscal 2008 to pay dividends of $0.70 per share,
for a total of $60.8 million and to repurchase approximately 0.7 million shares of A&F Common Stock
with a value of approximately $50.0 million. In Fiscal 2008, the Company borrowed $100.0 million under
the Company’s unsecured credit agreement to supplement cash from operations.
24
Source: ABERCROMBIE & FITCH CO /DE/, 10-K, March 27, 2009 Powered by Morningstar® Document Research℠


