Abercrombie & Fitch 2008 Annual Report Download - page 53
Download and view the complete annual report
Please find page 53 of the 2008 Abercrombie & Fitch annual report below. You can navigate through the pages in the report by either clicking on the pages listed below, or by using the keyword search tool below to find specific information within the annual report.-
 1
1 -
2
-
3
-
4
-
5
-
6
-
7
-
8
-
9
-
10
-
11
-
12
-
13
-
14
-
15
-
16
-
17
-
18
-
19
-
20
-
21
-
22
-
23
-
24
-
25
-
26
-
27
-
28
-
29
-
30
-
31
-
32
-
33
-
34
-
35
-
36
-
37
-
38
-
39
-
40
-
41
-
42
-
 43
43 -
 44
44 -
 45
45 -
 46
46 -
 47
47 -
 48
48 -
 49
49 -
 50
50 -
 51
51 -
 52
52 -
 53
53 -
 54
54 -
 55
55 -
 56
56 -
 57
57 -
 58
58 -
 59
59 -
 60
60 -
 61
61 -
 62
62 -
 63
63 -
64
-
65
-
66
-
67
-
68
-
69
-
70
-
71
-
72
-
73
-
74
-
75
-
76
-
77
-
78
-
79
-
80
-
81
-
82
-
83
-
84
-
85
-
86
-
87
-
88
-
89
-
90
-
91
-
92
-
93
-
94
-
95
-
96
-
97
-
98
-
99
-
100
-
101
-
102
-
103
-
104
-
105
-
106
-
107
-
108
-
109
-
110
-
111
-
112
-
113
-
114
-
115
-
116
-
117
-
118
-
119
-
120
-
121
-
122
-
123
-
124
-
125
-
126
-
127
-
128
-
129
-
130
-
131
-
132
-
133
-
134
-
135
-
136
-
137
-
138
-
139
-
140
-
141
-
142
-
143
-
144
-
145
-
146
-
147
-
148
-
149
-
150
-
151
-
152
-
153
-
154
-
155
-
156
-
157
-
158
-
159
-
160
 |
 |
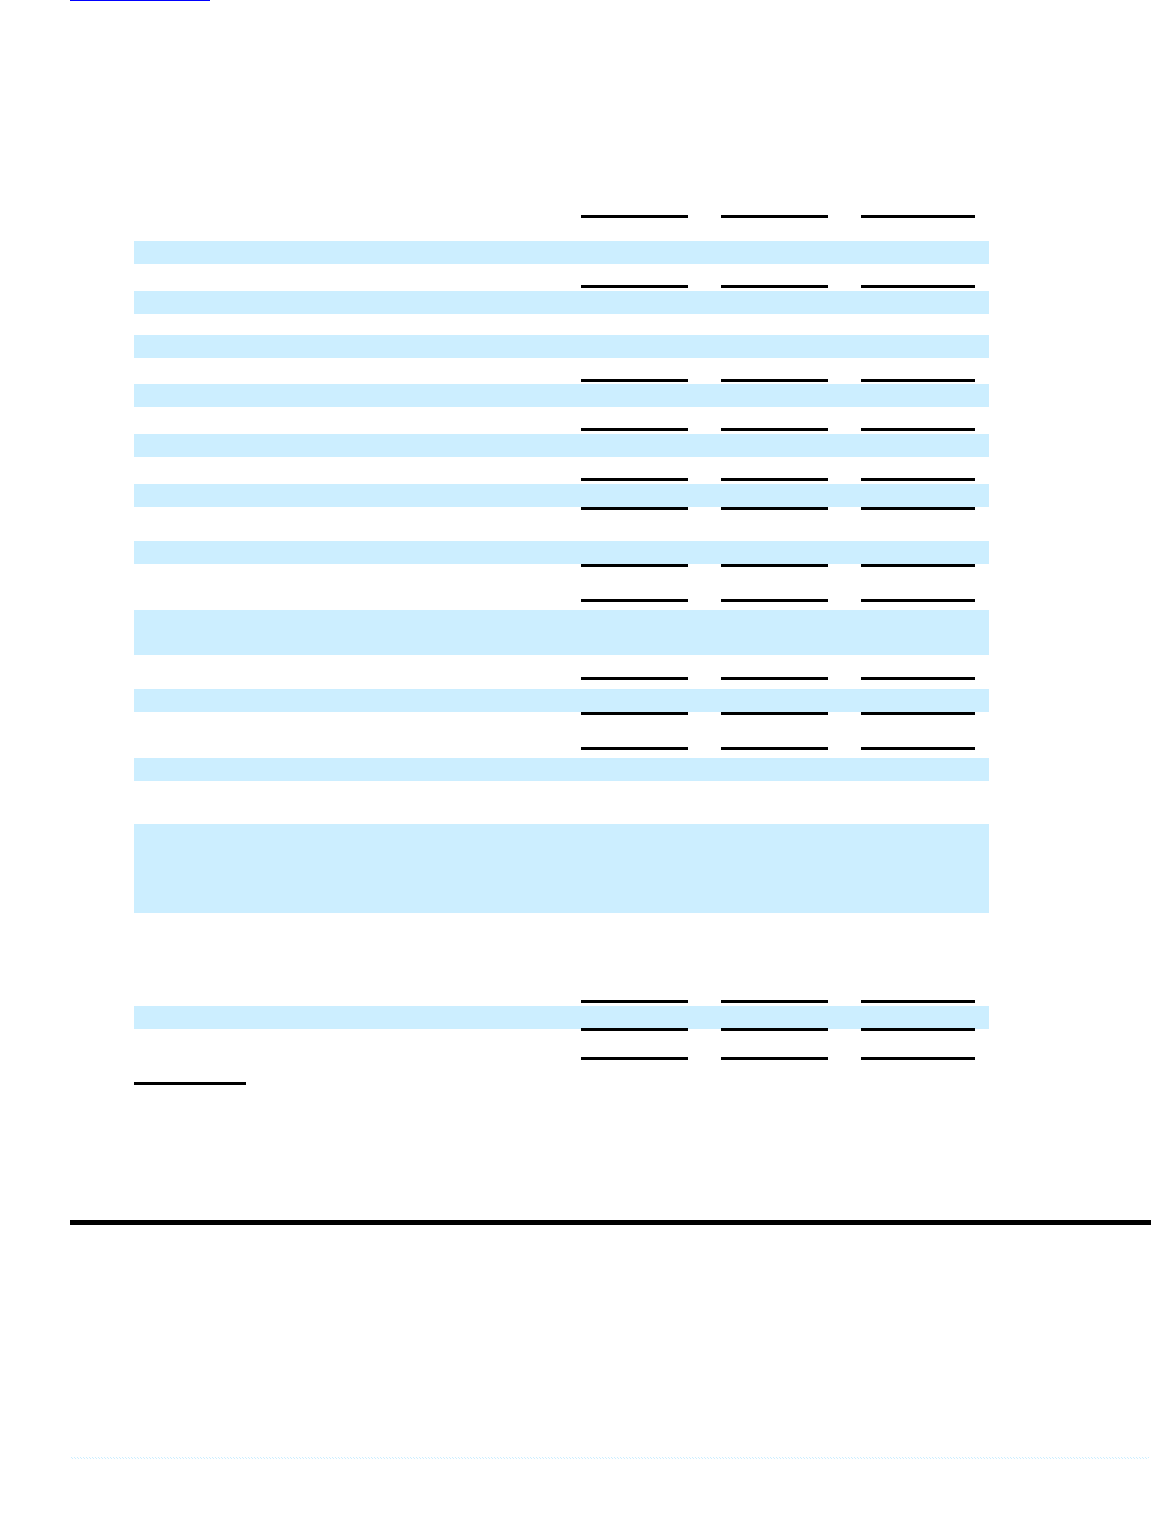
Table of Contents
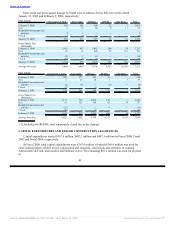
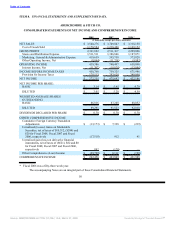
ITEM 8. FINANCIAL STATEMENTS AND SUPPLEMENTARY DATA.
ABERCROMBIE & FITCH CO.
CONSOLIDATED STATEMENTS OF NET INCOME AND COMPREHENSIVE INCOME
2008 2007 2006 *
(Thousands, except per share amounts)
NET SALES $ 3,540,276 $ 3,749,847 $ 3,318,158
Cost of Goods Sold 1,178,584 1,238,480 1,109,152
GROSS PROFIT 2,361,692 2,511,367 2,209,006
Stores and Distribution Expense 1,511,511 1,386,846 1,187,071
Marketing, General & Administrative Expense 419,659 395,758 373,828
Other Operating Income, Net (8,864) (11,734) (9,983)
OPERATING INCOME 439,386 740,497 658,090
Interest Income, Net (11,382) (18,828) (13,896)
INCOME BEFORE INCOME TAXES 450,768 759,325 671,986
Provision for Income Taxes 178,513 283,628 249,800
NET INCOME $ 272,255 $ 475,697 $ 422,186
NET INCOME PER SHARE:
BASIC $ 3.14 $ 5.45 $ 4.79
DILUTED $ 3.05 $ 5.20 $ 4.59
WEIGHTED-AVERAGE SHARES
OUTSTANDING:
BASIC 86,816 87,248 88,052
DILUTED 89,291 91,523 92,010
DIVIDENDS DECLARED PER SHARE $ 0.70 $ 0.70 $ 0.70
OTHER COMPREHENSIVE INCOME
Cumulative Foreign Currency Translation
Adjustments $ (13,173) $ 7,328 $ (239)
Unrealized (Losses) Gains on Marketable
Securities, net of taxes of $10,312, ($584) and
$20 for Fiscal 2008, Fiscal 2007 and Fiscal
2006, respectively (17,518) 912 41
Unrealized gain (loss) on derivative financial
instruments, net of taxes of ($621), $82 and $0
for Fiscal 2008, Fiscal 2007 and Fiscal 2006,
respectively 892 (128) —
Other Comprehensive (Loss) Income $ (29,799) $ 8,112 $ (198)
COMPREHENSIVE INCOME $ 242,456 $ 483,809 $ 421,988
* Fiscal 2006 was a fifty-three week year.
The accompanying Notes are an integral part of these Consolidated Financial Statements.
50
Source: ABERCROMBIE & FITCH CO /DE/, 10-K, March 27, 2009 Powered by Morningstar® Document Research℠