Abercrombie & Fitch 2008 Annual Report Download - page 57
Download and view the complete annual report
Please find page 57 of the 2008 Abercrombie & Fitch annual report below. You can navigate through the pages in the report by either clicking on the pages listed below, or by using the keyword search tool below to find specific information within the annual report.-
 1
1 -
2
-
3
-
4
-
5
-
6
-
7
-
8
-
9
-
10
-
11
-
12
-
13
-
14
-
15
-
16
-
17
-
18
-
19
-
20
-
21
-
22
-
23
-
24
-
25
-
26
-
27
-
28
-
29
-
30
-
31
-
32
-
33
-
34
-
35
-
36
-
37
-
38
-
39
-
40
-
41
-
42
-
43
-
44
-
45
-
46
-
 47
47 -
 48
48 -
 49
49 -
 50
50 -
 51
51 -
 52
52 -
 53
53 -
 54
54 -
 55
55 -
 56
56 -
 57
57 -
 58
58 -
 59
59 -
 60
60 -
 61
61 -
 62
62 -
 63
63 -
 64
64 -
 65
65 -
 66
66 -
 67
67 -
68
-
69
-
70
-
71
-
72
-
73
-
74
-
75
-
76
-
77
-
78
-
79
-
80
-
81
-
82
-
83
-
84
-
85
-
86
-
87
-
88
-
89
-
90
-
91
-
92
-
93
-
94
-
95
-
96
-
97
-
98
-
99
-
100
-
101
-
102
-
103
-
104
-
105
-
106
-
107
-
108
-
109
-
110
-
111
-
112
-
113
-
114
-
115
-
116
-
117
-
118
-
119
-
120
-
121
-
122
-
123
-
124
-
125
-
126
-
127
-
128
-
129
-
130
-
131
-
132
-
133
-
134
-
135
-
136
-
137
-
138
-
139
-
140
-
141
-
142
-
143
-
144
-
145
-
146
-
147
-
148
-
149
-
150
-
151
-
152
-
153
-
154
-
155
-
156
-
157
-
158
-
159
-
160
 |
 |
Table of Contents
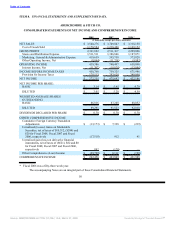
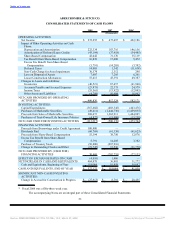
ABERCROMBIE & FITCH CO.
CONSOLIDATED STATEMENTS OF CASH FLOWS
2008 2007 2006*
(Thousands)
OPERATING ACTIVITIES:
Net Income $ 272,255 $ 475,697 $ 422,186
Impact of Other Operating Activities on Cash
Flows:
Depreciation and Amortization 225,334 183,716 146,156
Amortization of Deferred Lease Credits (43,194) (37,418) (34,485)
Share-Based Compensation 42,042 31,170 35,119
Tax Benefit from Share-Based Compensation 16,839 17,600 5,472
Excess Tax Benefit from Share-Based
Compensation (5,791) (14,205) (3,382)
Deferred Taxes 14,005 1,342 (11,638)
Non-Cash Charge for Asset Impairment 30,574 2,312 298
Loss on Disposal of Assets 7,607 7,205 6,261
Lessor Construction Allowances 55,415 43,391 49,387
Changes in Assets and Liabilities:
Inventories (40,521) 87,657 (61,940)
Accounts Payable and Accrued Expenses (23,875) 22,375 24,579
Income Taxes (55,565) (13,922) (12,805)
Other Assets and Liabilities (4,289) 10,604 16,963
NET CASH PROVIDED BY OPERATING
ACTIVITIES 490,836 817,524 582,171
INVESTING ACTIVITIES:
Capital Expenditures (367,602) (403,345) (403,476)
Purchases of Marketable Securities (49,411) (1,444,736) (1,459,835)
Proceeds from Sales of Marketable Securities 308,673 1,362,911 1,404,805
Purchases of Trust-Owned Life Insurance Policies (4,877) (15,000) (15,258)
NET CASH USED FOR INVESTING ACTIVITIES (113,217) (500,170) (473,764)
FINANCING ACTIVITIES:
Proceeds from Borrowings under Credit Agreement 100,000 — —
Dividends Paid (60,769) (61,330) (61,623)
Proceeds from Share-Based Compensation 55,194 38,750 12,876
Excess Tax Benefit from Share-Based
Compensation 5,791 14,205 3,382
Purchase of Treasury Stock (50,000) (287,916) —
Change in Outstanding Checks and Other (19,747) 13,536 (31,770)
NET CASH PROVIDED BY (USED FOR)
FINANCING ACTIVITIES 30,469 (282,755) (77,135)
EFFECT OF EXCHANGE RATES ON CASH (4,010) 1,486 —
NET INCREASE IN CASH AND EQUIVALENTS 404,078 36,085 31,272
Cash and Equivalents, Beginning of Year 118,044 81,959 50,687
CASH AND EQUIVALENTS, END OF YEAR $ 522,122 $ 118,044 $ 81,959
SIGNIFICANT NON-CASH INVESTING
ACTIVITIES:
Change in Accrual for Construction in Progress $ (27,913) $ 8,791 $ 28,455
* Fiscal 2006 was a fifty-three week year.
The accompanying Notes are an integral part of these Consolidated Financial Statements.
53
Source: ABERCROMBIE & FITCH CO /DE/, 10-K, March 27, 2009 Powered by Morningstar® Document Research℠