Abercrombie & Fitch 2008 Annual Report Download - page 38
Download and view the complete annual report
Please find page 38 of the 2008 Abercrombie & Fitch annual report below. You can navigate through the pages in the report by either clicking on the pages listed below, or by using the keyword search tool below to find specific information within the annual report.-
 1
1 -
2
-
3
-
4
-
5
-
6
-
7
-
8
-
9
-
10
-
11
-
12
-
13
-
14
-
15
-
16
-
17
-
18
-
19
-
20
-
21
-
22
-
23
-
24
-
25
-
26
-
27
-
 28
28 -
 29
29 -
 30
30 -
 31
31 -
 32
32 -
 33
33 -
 34
34 -
 35
35 -
 36
36 -
 37
37 -
 38
38 -
 39
39 -
 40
40 -
 41
41 -
 42
42 -
 43
43 -
 44
44 -
 45
45 -
 46
46 -
 47
47 -
 48
48 -
49
-
50
-
51
-
52
-
53
-
54
-
55
-
56
-
57
-
58
-
59
-
60
-
61
-
62
-
63
-
64
-
65
-
66
-
67
-
68
-
69
-
70
-
71
-
72
-
73
-
74
-
75
-
76
-
77
-
78
-
79
-
80
-
81
-
82
-
83
-
84
-
85
-
86
-
87
-
88
-
89
-
90
-
91
-
92
-
93
-
94
-
95
-
96
-
97
-
98
-
99
-
100
-
101
-
102
-
103
-
104
-
105
-
106
-
107
-
108
-
109
-
110
-
111
-
112
-
113
-
114
-
115
-
116
-
117
-
118
-
119
-
120
-
121
-
122
-
123
-
124
-
125
-
126
-
127
-
128
-
129
-
130
-
131
-
132
-
133
-
134
-
135
-
136
-
137
-
138
-
139
-
140
-
141
-
142
-
143
-
144
-
145
-
146
-
147
-
148
-
149
-
150
-
151
-
152
-
153
-
154
-
155
-
156
-
157
-
158
-
159
-
160
 |
 |

Table of Contents
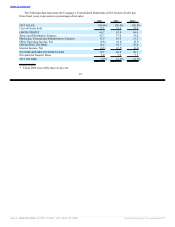
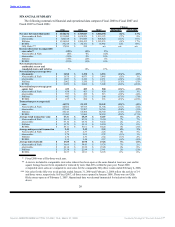
Gross Profit
For Fiscal 2007, gross profit increased to $2.511 billion from $2.209 billion in Fiscal 2006. The gross
profit rate for Fiscal 2007 was 67.0% versus 66.6% the previous year, an increase of 40 basis points. The
increase in the gross profit rate was driven primarily by a higher IMU rate and a lower shrink rate in the
fourth quarter of Fiscal 2007, partially offset by a higher markdown rate.
Stores and Distribution Expense
Stores and distribution expense for Fiscal 2007 was $1.387 billion compared to $1.187 billion for
Fiscal 2006. For Fiscal 2007, the stores and distribution expense rate was 37.0% compared to 35.8% in
the previous year. The increase in rate resulted primarily from store payroll, including minimum wage and
store manager salary increases, higher store fixed cost rates and store packaging and supply expenses.
Marketing, General and Administrative Expense
Marketing, general and administrative expense during Fiscal 2007 was $395.8 million compared to
$373.8 million in Fiscal 2006. For Fiscal 2007, the marketing, general and administrative expense rate
was 10.6%, a decrease of 70 basis points compared to Fiscal 2006’s rate of 11.3%. The decrease in rate
resulted from reductions in travel, samples and outside services expense rates, partially offset by the
increase in payroll expense rate.
Other Operating Income, Net
Other operating income for Fiscal 2007 was $11.7 million compared to $10.0 million for Fiscal 2006.
The increase was primarily related to gift cards for which the Company determined the likelihood of
redemption to be remote, partially offset by decreases in gains related to foreign currency transactions.
The comparable period in Fiscal 2006 included other operating income related to insurance
reimbursements for a fire-damaged store and a store damaged by Hurricane Katrina.
Operating Income
Fiscal 2007 operating income was $740.5 million compared to $658.1 million for Fiscal 2006, an
increase of 12.5%. The operating income rate for Fiscal 2007 was 19.7% versus 19.8% in the previous
year.
Interest Income, Net and Income Taxes
Net interest income for Fiscal 2007 was $18.8 million compared to $13.9 million for Fiscal 2006. The
increase in net interest income was due to higher interest rates and higher available investment balances
during Fiscal 2007 compared to Fiscal 2006.
The effective tax rate for Fiscal 2007 was 37.4% compared to 37.2% for Fiscal 2006.
Net Income and Net Income per Share
Net income for Fiscal 2007 was $475.7 million versus $422.2 million in Fiscal 2006, an increase of
12.7%. Net income per diluted weighted-average share was $5.20 in Fiscal 2007 versus $4.59 in Fiscal
2006, an increase of 13.3%.
35
Source: ABERCROMBIE & FITCH CO /DE/, 10-K, March 27, 2009 Powered by Morningstar® Document Research℠