TomTom 2015 Annual Report Download - page 96
Download and view the complete annual report
Please find page 96 of the 2015 TomTom annual report below. You can navigate through the pages in the report by either clicking on the pages listed below, or by using the keyword search tool below to find specific information within the annual report.-
 1
1 -
2
-
3
-
4
-
5
-
6
-
7
-
8
-
9
-
10
-
11
-
12
-
13
-
14
-
15
-
16
-
17
-
18
-
19
-
20
-
21
-
22
-
23
-
24
-
25
-
26
-
27
-
28
-
29
-
30
-
31
-
32
-
33
-
34
-
35
-
36
-
37
-
38
-
39
-
40
-
41
-
42
-
43
-
44
-
45
-
46
-
47
-
48
-
49
-
50
-
51
-
52
-
53
-
54
-
55
-
56
-
57
-
58
-
59
-
60
-
61
-
62
-
63
-
64
-
65
-
66
-
67
-
68
-
69
-
70
-
71
-
72
-
73
-
74
-
75
-
76
-
77
-
78
-
79
-
80
-
81
-
82
-
83
-
84
-
85
-
 86
86 -
 87
87 -
 88
88 -
 89
89 -
 90
90 -
 91
91 -
 92
92 -
 93
93 -
 94
94 -
 95
95 -
 96
96 -
 97
97 -
 98
98 -
 99
99 -
 100
100 -
 101
101 -
 102
102 -
 103
103 -
 104
104 -
 105
105 -
 106
106 -
107
-
108
-
109
-
110
-
111
-
112
-
113
-
114
-
115
-
116
-
117
-
118
-
119
-
120
-
121
-
122
-
123
-
124
-
125
-
126
-
127
-
128
-
129
 |
 |

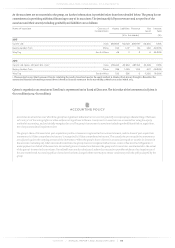
CONSOLIDATED FINANCIAL STATEMENTS
TOMTOM / ANNUAL REPORT AND ACCOUNTS 2015 / 95
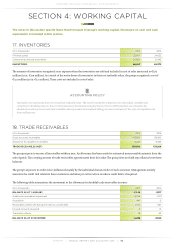
SECTION 4: WORKING CAPITAL
The notes in this section specify items that form part of group’s working capital. Disclosure on cash and cash
equivalents is included in this section.
17. INVENTORIES
(€ in thousands) 2015 2014
Finished goods 23,807 24,632
Components and sub-assemblies 24,850 21,943
INVENTORIES 48,657 46,575
The amount of inventories recognised as an expense when the inventories are sold and included in cost of sales amounted to €373
million (2014: €319 million). As a result of the write-down of inventories to their net realisable value, the group recognised a cost of
€4.4 million (2014: €3.1 million). These costs are included in cost of sales.
ACCOUNTING POLICY
Inventories are stated at the lower of cost and net realisable value. The cost of inventories comprises costs of purchase, assembly and
conversion to finished products. The cost of inventories is determined using the first-in, first-out (FIFO) method, net of reserves for
obsolescence and any excess stock. Net realisable value represents the estimated selling price less an estimate of the costs of completion and
direct selling costs.
18. TRADE RECEIVABLES
(€ in thousands) 2015 2014
Gross accounts receivables 142,829 136,812
Allowance for doubtful receivables -4,236 -3,546
TRADE RECEIVABLES (NET) 138,593 133,266
The group expects to recover all receivables within a year. An allowance has been made for estimated unrecoverable amounts from the
sale of goods. The carrying amount of trade receivables approximates their fair value. The group does not hold any collateral over these
balances.
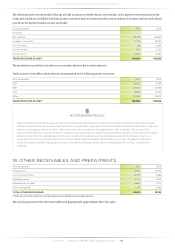
The group's exposure to credit risk is influenced mainly by the individual characteristics of each customer. Management actively
monitors the credit risk related to these customers and takes pro-active action to reduce credit limits if required.
The following table summarises the movement in the allowance for doubtful trade receivables account:
(€ in thousands) 2015 2014
BALANCE AS AT 1 JANUARY -3,546 -3,117
Additional receivables impairment -2,299 -1,321
Acquisition -641 0
Receivables written off during the year as uncollectible 2,172 837
Unused amounts reversed 0 15
Translation effects 78 40
BALANCE AS AT 31 DECEMBER -4,236 -3,546