TomTom 2015 Annual Report Download - page 89
Download and view the complete annual report
Please find page 89 of the 2015 TomTom annual report below. You can navigate through the pages in the report by either clicking on the pages listed below, or by using the keyword search tool below to find specific information within the annual report.-
 1
1 -
2
-
3
-
4
-
5
-
6
-
7
-
8
-
9
-
10
-
11
-
12
-
13
-
14
-
15
-
16
-
17
-
18
-
19
-
20
-
21
-
22
-
23
-
24
-
25
-
26
-
27
-
28
-
29
-
30
-
31
-
32
-
33
-
34
-
35
-
36
-
37
-
38
-
39
-
40
-
41
-
42
-
43
-
44
-
45
-
46
-
47
-
48
-
49
-
50
-
51
-
52
-
53
-
54
-
55
-
56
-
57
-
58
-
59
-
60
-
61
-
62
-
63
-
64
-
65
-
66
-
67
-
68
-
69
-
70
-
71
-
72
-
73
-
74
-
75
-
76
-
77
-
78
-
 79
79 -
 80
80 -
 81
81 -
 82
82 -
 83
83 -
 84
84 -
 85
85 -
 86
86 -
 87
87 -
 88
88 -
 89
89 -
 90
90 -
 91
91 -
 92
92 -
 93
93 -
 94
94 -
 95
95 -
 96
96 -
 97
97 -
 98
98 -
 99
99 -
100
-
101
-
102
-
103
-
104
-
105
-
106
-
107
-
108
-
109
-
110
-
111
-
112
-
113
-
114
-
115
-
116
-
117
-
118
-
119
-
120
-
121
-
122
-
123
-
124
-
125
-
126
-
127
-
128
-
129
 |
 |

CONSOLIDATED FINANCIAL STATEMENTS
TOMTOM / ANNUAL REPORT AND ACCOUNTS 2015 / 88
SECTION 3: NON-CURRENT ASSETS
AND INVESTMENTS
The notes in this section specify the group’s non-current assets including investments made during the year
either through separate asset acquisitions or business combinations.
12. INTANGIBLE ASSETS
(€ in thousands) 2015 2014
Goodwill 403,437 381,569
Other intangible assets 810,908 800,583
TOTAL INTANGIBLE ASSETS 1,214,345 1,182,152
The movements in the intangible assets are as follows:
(€ in thousands) Goodwill Database and
tools3
Internally
generated
Other1Total
BALANCE AS AT 31 DECEMBER 2013
Investment cost 1,902,489 997,021 143,319 238,172 3,281,001
Accumulated amortisation and impairment -1,520,920 -299,315 -83,656 -191,906 -2,095,797
381,569 697,706 59,663 46,266 1,185,204
Movements
Investments 0 38,114 30,434 5,203 73,751
Acquisitions through business combination 0 381 0 24,167 24,548
Disposal (net) 0 -17 -125 -63 -205
Amortisation charges 0 -66,972 -26,801 -8,317 -102,090
Currency translation differences 0 720 82 142 944
0 -27,774 3,590 21,132 -3,052
BALANCE AS AT 31 DECEMBER 2014
Investment cost 1,902,489 1,036,892 139,741 250,795 3,329,917
Accumulated amortisation and impairment -1,520,920 -366,960 -76,488 -183,397 -2,147,765
381,569 669,932 63,253 67,398 1,182,152
Movements
Investments 0 44,649 36,140 13,183 93,972
Acquisitions through business combination 21,868 10,942 0 15,459 48,269
Disposal (net)20 0 0 -36 -36
Amortisation charges 0 -66,051 -18,377 -12,697 -97,125
Impairment 0 0 -11,484 0 -11,484
Currency translation differences 0 -1,846 283 160 -1,403
21,868 -12,306 6,562 16,069 32,193
BALANCE AS AT 31 DECEMBER 2015
Investment cost 1,924,357 1,068,496 171,443 239,146 3,403,442
Accumulated amortisation and impairment -1,520,920 -410,870 -101,628 -155,679 -2,189,097
403,437 657,626 69,815 83,467 1,214,345
1. Other intangible assets include technology, customer relationships, brand name and software.
2. During the year we disposed certain intangibles. The total gross amount of the assets disposed across all asset classes was €66.9 million (2014: €51.8 million).
3. The database as acquired at acquisition date (June 2008) represents geographical content data used for the group's digital maps and has a remaining useful life of 12 years
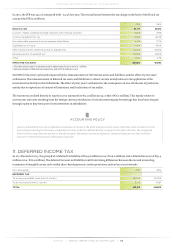
and 5 months.