TomTom 2015 Annual Report Download - page 34
Download and view the complete annual report
Please find page 34 of the 2015 TomTom annual report below. You can navigate through the pages in the report by either clicking on the pages listed below, or by using the keyword search tool below to find specific information within the annual report.-
 1
1 -
2
-
3
-
4
-
5
-
6
-
7
-
8
-
9
-
10
-
11
-
12
-
13
-
14
-
15
-
16
-
17
-
18
-
19
-
20
-
21
-
22
-
23
-
 24
24 -
 25
25 -
 26
26 -
 27
27 -
 28
28 -
 29
29 -
 30
30 -
 31
31 -
 32
32 -
 33
33 -
 34
34 -
 35
35 -
 36
36 -
 37
37 -
 38
38 -
 39
39 -
 40
40 -
 41
41 -
 42
42 -
 43
43 -
 44
44 -
45
-
46
-
47
-
48
-
49
-
50
-
51
-
52
-
53
-
54
-
55
-
56
-
57
-
58
-
59
-
60
-
61
-
62
-
63
-
64
-
65
-
66
-
67
-
68
-
69
-
70
-
71
-
72
-
73
-
74
-
75
-
76
-
77
-
78
-
79
-
80
-
81
-
82
-
83
-
84
-
85
-
86
-
87
-
88
-
89
-
90
-
91
-
92
-
93
-
94
-
95
-
96
-
97
-
98
-
99
-
100
-
101
-
102
-
103
-
104
-
105
-
106
-
107
-
108
-
109
-
110
-
111
-
112
-
113
-
114
-
115
-
116
-
117
-
118
-
119
-
120
-
121
-
122
-
123
-
124
-
125
-
126
-
127
-
128
-
129
 |
 |

MANAGEMENT BOARD REPORT
TOMTOM / ANNUAL REPORT AND ACCOUNTS 2015 / 33
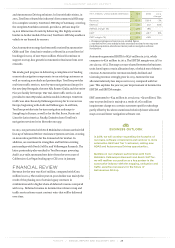
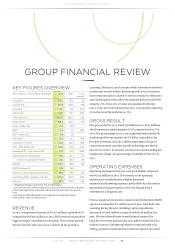
GROUP FINANCIAL REVIEW
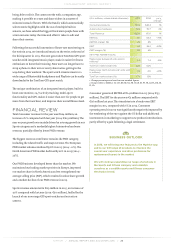
KEY FIGURES OVERVIEW
(€ in millions, unless stated otherwise) 2015 2014 y.o.y.
change1
Consumer 623.6 619.1 1%
Automotive 105.9 109.4 -3%
Licensing 142.1 111.6 27%
Telematics 135.0 110.2 22%
Total Revenue 1,006.6 950.3 6%
Gross result2518.5 523.3 -1%
Gross margin (%) 52% 55%
EBIT20.6 21.1 -97%
EBIT margin (%) 0% 2%
Net result218.3 22.7 -19%
Adjusted net result349.6 60.3 -18%
EPS - fully diluted (€) 0.08 0.10 -22%
Adjusted EPS - fully diluted (€)40.21 0.27 -20%
Depreciation & amortisation2123.1 114.7 7%
of which acquisition-related 52.1 50.3 3%
EBITDA 123.7 135.8 -9%
EBITDA margin % 12% 14%
Cash flows from operating activities 118.8 118.6 0%
Cash flows from investing activities -154.2 -106.5 45%
Net cash 98.3 103.0 -5%
1. Change percentages are based on non-rounded figures.
2. 2015 includes a €11 million impairment charge on customer specific technology.
3. Net result adjusted for acquisition-related amortisation & gain on a post-tax
basis.
4. Earnings per fully diluted share count adjusted for acquisition-related
amortisation & gain on a post-tax basis.
REVENUE
In 2015, we generated revenue of €1,007 million, a growth of 6%
compared with €950 million in 2014. PND revenue remained the
biggest revenue contributor for the group. This revenue growth,
which is the first time since 2010, is driven by the growth in
Licensing, Telematics and Consumer while Automotive showed a
modest year on year decline. Revenue growth in our Consumer
Sports business and in Content & Services revenue in Telematics
and Licensing more than offset the marginal decline in the PND
category. 77% of our 2015 revenue was generated in Europe
(2014: 76%), 18% in North America (2014: 17%) and the remaining
5% in the rest of the world (2014: 7%).
GROSS RESULT
Our gross result for 2015 was €519 million (2014: €523 million),
which represents a gross margin of 52% compared with 55% in
2014. Our gross margin in 2015 was negatively impacted by the
weakening of the euro against the US dollar, especially in the
first half of the year, and a €11 million impairment charge of
certain Automotive customer specific technology recorded as
part of cost of sales. At constant currency rates and excluding this
impairment charge, our gross margin would have been 57% in
2015.
OPERATING EXPENSES
Operating expenses for the year were €518 million compared
with €502 million in 2014. The increase in our operating
expenses was mainly driven by higher personnel
expenses and marketing expenses, partly offset by a decrease in
depreciation and amortisation and a one-off gain from a
settlement of a litigation case.
From a categorical perspective, research and development (R&D)
expenses increased by €11 million year on year. Total R&D cash
spending during the year, including capital expenditures,
amounted to €268 million compared with €246 million last
year. We also invested more in marketing to support the
launches of our new products this year, which resulted in a €14
million increase of marketing expenses compared with 2014.
Selling, general and administrative (SG&A) expenses increased