TomTom 2015 Annual Report Download - page 100
Download and view the complete annual report
Please find page 100 of the 2015 TomTom annual report below. You can navigate through the pages in the report by either clicking on the pages listed below, or by using the keyword search tool below to find specific information within the annual report.-
 1
1 -
2
-
3
-
4
-
5
-
6
-
7
-
8
-
9
-
10
-
11
-
12
-
13
-
14
-
15
-
16
-
17
-
18
-
19
-
20
-
21
-
22
-
23
-
24
-
25
-
26
-
27
-
28
-
29
-
30
-
31
-
32
-
33
-
34
-
35
-
36
-
37
-
38
-
39
-
40
-
41
-
42
-
43
-
44
-
45
-
46
-
47
-
48
-
49
-
50
-
51
-
52
-
53
-
54
-
55
-
56
-
57
-
58
-
59
-
60
-
61
-
62
-
63
-
64
-
65
-
66
-
67
-
68
-
69
-
70
-
71
-
72
-
73
-
74
-
75
-
76
-
77
-
78
-
79
-
80
-
81
-
82
-
83
-
84
-
85
-
86
-
87
-
88
-
89
-
 90
90 -
 91
91 -
 92
92 -
 93
93 -
 94
94 -
 95
95 -
 96
96 -
 97
97 -
 98
98 -
 99
99 -
 100
100 -
 101
101 -
 102
102 -
 103
103 -
 104
104 -
 105
105 -
 106
106 -
 107
107 -
 108
108 -
 109
109 -
 110
110 -
111
-
112
-
113
-
114
-
115
-
116
-
117
-
118
-
119
-
120
-
121
-
122
-
123
-
124
-
125
-
126
-
127
-
128
-
129
 |
 |

CONSOLIDATED FINANCIAL STATEMENTS
TOMTOM / ANNUAL REPORT AND ACCOUNTS 2015 / 99
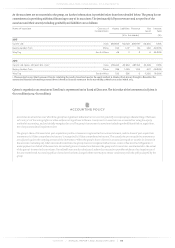
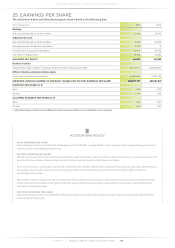
25. EARNINGS PER SHARE
The calculation of basic and diluted earnings per share is based on the following data:
(€ in thousands) 2015 2014
Earnings
Net result attributed to equity holders 18,122 22,549
Adjusted net result
Net result attributed to equity holders 18,122 22,549
Remeasurement of deferred tax liability -7,535 0
Amortisation of acquired intangibles 52,056 50,332
Tax effect of adjustments -13,014 -12,583
ADJUSTED NET RESULT 49,629 60,298
Number of shares
Weighted average number of ordinary shares for basic earnings per share 227,771,117 222,689,197
Effect of dilutive potential ordinary shares
Share options and restricted stock 4,606,654 2,432,734
WEIGHTED AVERAGE NUMBER OF ORDINARY SHARES FOR DILUTED EARNINGS PER SHARE 232,377,771 225,121,931
EARNINGS PER SHARE (in €)
Basic 0.08 0.10
Diluted 0.08 0.10
ADJUSTED EARNINGS PER SHARE (in €)1
Basic 0.21 0.27
Diluted 0.21 0.27
1. Adjusted earnings per share is not an IFRS performance measure and hence is not comparable across companies.
ACCOUNTING POLICY
BASIC EARNINGS PER SHARE
Basic earnings per share is calculated by dividing the profit attributable to equity holders of the company by the weighted average number of
ordinary shares outstanding during the year.
DILUTED EARNINGS PER SHARE
Diluted earnings per share is calculated by adjusting the weighted average number of ordinary shares outstanding to assume conversion of all
potential dilutive ordinary shares arising from stock options and other equity-settled share-based plans.
For the stock options, a calculation is performed to determine the number of shares that could have been acquired at fair value (determined as
the average annual market share price of the company's shares), based on the monetary value of the subscription rights attached to
outstanding share options.
The number of shares calculated as above is compared with the number of shares that would have been issued, assuming the exercise of the
stock options. When the effect of the options and other equity-settled share-based plans is anti-dilutive, the number is excluded from the
calculation of diluted earnings.
ADJUSTED EARNINGS PER SHARE
Adjusted earnings per share is calculated by dividing the adjusted earnings by the weighted average number of ordinary and diluted shares
outstanding during the year.