TomTom 2015 Annual Report Download - page 35
Download and view the complete annual report
Please find page 35 of the 2015 TomTom annual report below. You can navigate through the pages in the report by either clicking on the pages listed below, or by using the keyword search tool below to find specific information within the annual report.-
 1
1 -
2
-
3
-
4
-
5
-
6
-
7
-
8
-
9
-
10
-
11
-
12
-
13
-
14
-
15
-
16
-
17
-
18
-
19
-
20
-
21
-
22
-
23
-
24
-
 25
25 -
 26
26 -
 27
27 -
 28
28 -
 29
29 -
 30
30 -
 31
31 -
 32
32 -
 33
33 -
 34
34 -
 35
35 -
 36
36 -
 37
37 -
 38
38 -
 39
39 -
 40
40 -
 41
41 -
 42
42 -
 43
43 -
 44
44 -
 45
45 -
46
-
47
-
48
-
49
-
50
-
51
-
52
-
53
-
54
-
55
-
56
-
57
-
58
-
59
-
60
-
61
-
62
-
63
-
64
-
65
-
66
-
67
-
68
-
69
-
70
-
71
-
72
-
73
-
74
-
75
-
76
-
77
-
78
-
79
-
80
-
81
-
82
-
83
-
84
-
85
-
86
-
87
-
88
-
89
-
90
-
91
-
92
-
93
-
94
-
95
-
96
-
97
-
98
-
99
-
100
-
101
-
102
-
103
-
104
-
105
-
106
-
107
-
108
-
109
-
110
-
111
-
112
-
113
-
114
-
115
-
116
-
117
-
118
-
119
-
120
-
121
-
122
-
123
-
124
-
125
-
126
-
127
-
128
-
129
 |
 |

MANAGEMENT BOARD REPORT
TOMTOM / ANNUAL REPORT AND ACCOUNTS 2015 / 34
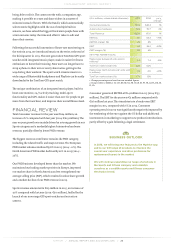
by €2 million year on year to €172 million, mainly due to higher
sales expenses in Telematics, which was the result of a
combination of more FTE and higher amortisation related to
acquisitions.
Total depreciation, amortisation and impairment for the year
was €123 million (2014: €115 million) which includes a €11
million impairment charge recorded in cost of sales.
Amortisation of technology and databases decreased by €11
million year on year, partly driven by lower amortisation due to
change in useful life of certain navigation technologies.
Acquisition-related amortisation increased to €52 million from
€50 million in 2014, mainly reflecting additional amortisation
from acquisitions that took place at the end of 2014 and early
2015, partly offset by lower amortisation on mapmaking tools.
As a result of the above-mentioned increase in operating
expenses and the decrease in our gross margin, our EBIT for the
year was at break-even compared with €21 million last year.
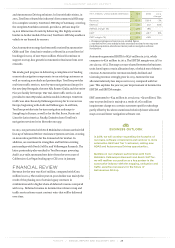
FINANCIAL RESULTS AND
TAXATION
The net interest expense for the year was €0.9 million versus
€3.1 million in 2014, mainly due to lower interest rates applied
against lower outstanding borrowings during the year. The other
financial result consisted mainly of a foreign currency loss of
€7.4 million compared with a loss of €3.8 million in 2014.
The income tax for the year was a gain of €26 million, mainly as a
result of remeasuring certain deferred tax assets and liabilities to
a lower rate due to the application of the innovation box facility
in the Netherlands, as well as some other one-off releases of
provisions.
NET RESULT
The net result for the year was €18 million (2014: €23 million).
The net result adjusted for acquisition-related amortisation &
gain on a post-tax basis was €50 million compared with €60
million in 2014. The adjusted EPS for the year was €0.21 (2014:
€0.27).
INVESTMENTS
Total cash used in investing activities in 2015 was €154 million,
an increase of €48 million compared with €106 million in 2014,
reflecting increased investments in our technology platforms
and acquisitions. We continued investing in our core
technologies such as our transactional mapmaking platform and
the NDS based navigation system and expanded our global map
footprint through acquisition of an Australian mapping
company. We also further expanded our Telematics business by
acquiring Finder S.A., the leading fleet management service
provider in Poland.
CASH FLOW FROM
OPERATIONS, LIQUIDITY AND
DEBT FINANCING
Net cash from operating activities for the year was €119 million,
flat compared with 2014, despite the lower operating result in
2015.
Net cash from financing activities for the year was a net cash
inflow of €29 million compared with a net cash outflow of €118
million in 2014, the latter mainly related to a loan repayment
of €125 million in December 2014. The net cash inflow for 2015
mainly came from €34 million cash inflow from the exercise of
6.9 million options related to our long-term employee incentive
programmes, partly offset by a €5 million repayment of our loan
facility during the year.
At the end of 2015, our net cash position was €98 million (2014:
€103 million). Our outstanding borrowings comprised of €45
million that we utilised from our revolving credit facility of €250
million and some external borrowings from the recently
acquired Polish subsidiary amounting to €4 million.
2016 OUTLOOK
In 2016, we plan for revenue and earnings growth. We
expect revenue of around €1,050 million. Adjusted
EPS is expected to grow by around 10% to €0.23.
We expect the level of investment (both CAPEX and
OPEX) in our core technologies to be higher than last
year. In particular, we are investing in advanced
content and software for the automotive industry (e.g.
to enable Autonomous Driving) and in our new
mapmaking platform.
The number of employees in 2016 is expected to be
higher compared with 2015.