TomTom 2015 Annual Report Download - page 92
Download and view the complete annual report
Please find page 92 of the 2015 TomTom annual report below. You can navigate through the pages in the report by either clicking on the pages listed below, or by using the keyword search tool below to find specific information within the annual report.-
 1
1 -
2
-
3
-
4
-
5
-
6
-
7
-
8
-
9
-
10
-
11
-
12
-
13
-
14
-
15
-
16
-
17
-
18
-
19
-
20
-
21
-
22
-
23
-
24
-
25
-
26
-
27
-
28
-
29
-
30
-
31
-
32
-
33
-
34
-
35
-
36
-
37
-
38
-
39
-
40
-
41
-
42
-
43
-
44
-
45
-
46
-
47
-
48
-
49
-
50
-
51
-
52
-
53
-
54
-
55
-
56
-
57
-
58
-
59
-
60
-
61
-
62
-
63
-
64
-
65
-
66
-
67
-
68
-
69
-
70
-
71
-
72
-
73
-
74
-
75
-
76
-
77
-
78
-
79
-
80
-
81
-
 82
82 -
 83
83 -
 84
84 -
 85
85 -
 86
86 -
 87
87 -
 88
88 -
 89
89 -
 90
90 -
 91
91 -
 92
92 -
 93
93 -
 94
94 -
 95
95 -
 96
96 -
 97
97 -
 98
98 -
 99
99 -
 100
100 -
 101
101 -
 102
102 -
103
-
104
-
105
-
106
-
107
-
108
-
109
-
110
-
111
-
112
-
113
-
114
-
115
-
116
-
117
-
118
-
119
-
120
-
121
-
122
-
123
-
124
-
125
-
126
-
127
-
128
-
129
 |
 |

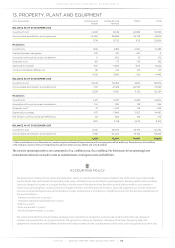
CONSOLIDATED FINANCIAL STATEMENTS
TOMTOM / ANNUAL REPORT AND ACCOUNTS 2015 / 91
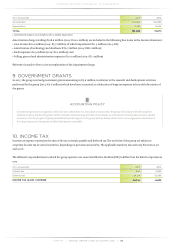
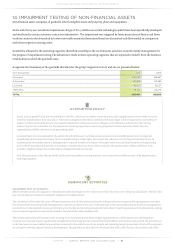
14. IMPAIRMENT TESTING OF NON-FINANCIAL ASSETS
Non-financial assets comprises of goodwill, other intangible assets and property, plant and equipment.
At the end of 2015 we recorded an impairment charge of €11.5 million on certain technologies which have been specifically developed
and attributed to certain customer contracts in Automotive . The impairment was triggered by lower projections of future cash flows
on those contracts which resulted in lower recoverable amounts (determined based on discounted cash flow model) in comparison
with their respective carrying value.
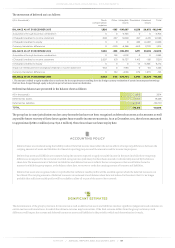
Goodwill is allocated to the operating segments identified according to the core business activities as monitored by management for
the purpose of impairment testing. The allocation is made to those operating segments that are expected to benefit from the business
combination in which the goodwill arose.
A segment-level summary of the goodwill allocation for the group's segments in 2015 and 2014 is presented below:
(€ in thousands) 2015 2014
Consumer 168,687 168,687
Automotive 83,389 83,389
Licensing 85,217 85,217
Telematics 66,144 44,276
TOTAL 403,437 381,569
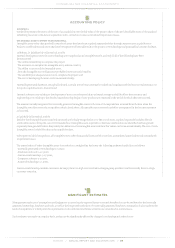
ACCOUNTING POLICY
Assets, such as goodwill, that have an indefinite useful life, which are not subject to amortisation, and intangible assets not yet ready to use are
tested for impairment at least annually, or whenever management identifies conditions that may trigger a risk of impairment. Assets that are
subject to amortisation/depreciation are tested for impairment whenever events or changes in circumstances indicate that the carrying
amount may not be recoverable. For the purposes of assessing impairment, assets are grouped at the lowest levels for which there are
separately identifiable cash flows (cash-generating units).
An impairment loss is recognised for the amount by which the asset's carrying amount exceeds its recoverable amount and is recognised
immediately in the income statement. The recoverable amount is the higher of an asset's fair value less costs of disposal and value in use. In
estimating the recoverable amount, management is required to make an estimate of the expected future cash flows from the cash-generating
unit in the forecasted period and also to determine a suitable discount rate in order to calculate the present value of those cash flows. Such
estimates might be subject to a certain degree of judgement and uncertainty.
Non-financial assets, other than goodwill, which have been subject to an impairment, are reviewed for possible reversal of the impairment at
each reporting date.
SIGNIFICANT ESTIMATES
IMPAIRMENT TEST OF GOODWILL
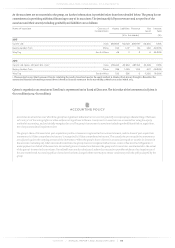
The recoverable amount of a segment is determined based on the higher of the value in use or fair value less costs of disposal calculations. The fair value
less costs of disposal calculation resulted in a higher recoverable amount.
The calculations of fair value less costs of disposal use post-tax cash flow projections based on financial forecasts approved by management covering a
five-year period (forecasted period). Management's cash flow projections for each of the segments in the forecasted period are based on management's
assumptions on the expected revenue growth rate, gross margin and operating margin after allocation of operating expenses from shared units, taking
into account management's expectation of market size and market share development.
The revenue projections of Consumer and Licensing in the forecasted period show a single digit growth rate, while Automotive and Telematics
revenues are projected to grow significantly throughout the forecasted period. Given the limited visibility on the longer-term growth, the growth rates
in the later years are more subject to uncertainty compared to the earlier years. Gross margin and operating margin projections of each of the segments
are consistent with the expected revenue developments. The growth rates after the forecasted period as well as the discount rate used for each of the