TomTom 2015 Annual Report Download - page 80
Download and view the complete annual report
Please find page 80 of the 2015 TomTom annual report below. You can navigate through the pages in the report by either clicking on the pages listed below, or by using the keyword search tool below to find specific information within the annual report.-
 1
1 -
2
-
3
-
4
-
5
-
6
-
7
-
8
-
9
-
10
-
11
-
12
-
13
-
14
-
15
-
16
-
17
-
18
-
19
-
20
-
21
-
22
-
23
-
24
-
25
-
26
-
27
-
28
-
29
-
30
-
31
-
32
-
33
-
34
-
35
-
36
-
37
-
38
-
39
-
40
-
41
-
42
-
43
-
44
-
45
-
46
-
47
-
48
-
49
-
50
-
51
-
52
-
53
-
54
-
55
-
56
-
57
-
58
-
59
-
60
-
61
-
62
-
63
-
64
-
65
-
66
-
67
-
68
-
69
-
 70
70 -
 71
71 -
 72
72 -
 73
73 -
 74
74 -
 75
75 -
 76
76 -
 77
77 -
 78
78 -
 79
79 -
 80
80 -
 81
81 -
 82
82 -
 83
83 -
 84
84 -
 85
85 -
 86
86 -
 87
87 -
 88
88 -
 89
89 -
 90
90 -
91
-
92
-
93
-
94
-
95
-
96
-
97
-
98
-
99
-
100
-
101
-
102
-
103
-
104
-
105
-
106
-
107
-
108
-
109
-
110
-
111
-
112
-
113
-
114
-
115
-
116
-
117
-
118
-
119
-
120
-
121
-
122
-
123
-
124
-
125
-
126
-
127
-
128
-
129
 |
 |

CONSOLIDATED FINANCIAL STATEMENTS
TOMTOM / ANNUAL REPORT AND ACCOUNTS 2015 / 79
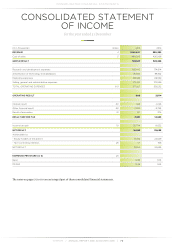
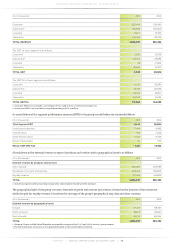
(€ in thousands) 2015 2014
Consumer 623,648 619,099
Automotive 105,884 109,409
Licensing 142,117 111,575
Telematics 134,958 110,209
TOTAL REVENUE 1,006,607 950,292
The EBIT of each segment is as follows:
Consumer12,636 36,168
Automotive2-33,924 - 28,685
Licensing 48 - 11,360
Telematics 39,686 33,801
TOTAL EBIT 8,446 29,924
The EBITDA of each segment is as follows:
Consumer 14,055 55,349
Automotive 26,133 20,093
Licensing 42,286 30,091
Telematics 49,030 39,102
TOTAL EBITDA 131,504 144,635
1. Consumer EBIT in 2015 includes a one-off gain of €9.0 million from a settlement of a legal case.
2. Automotive EBIT in 2015 includes an impairment charge of €11.5 million.
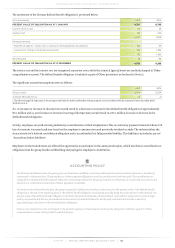
A reconciliation of the segment performance measure (EBIT) to the group's result before tax is provided below.
(€ in thousands) 2015 2014
Total Segment EBIT 8,446 29,924
Unallocated expenses -7,846 -8,810
Interest result -925 -3,145
Other finance result -7,343 -3,720
Result of associates 167 374
RESULT BEFORE TAX - 7,501 14,623
A breakdown of the external revenue to types of products and services and to geographical areas is as follows.
(€ in thousands) 2015 2014
External revenue by products and services
Sale of goods1586,089 578,086
Rendering of content and services 202,562 188,600
Royalty revenue 217,956 183,606
TOTAL 1,006,607 950,292
1. Includes navigation software and map components sold initially in bundle with the hardware.
The geographical split of the group's revenue from sale of goods and content and services is based on the location of the customers,
while the split for royalty revenue is based on the coverage of the group's geographical map data and other contents.
(€ in thousands) 2015 2014
External revenue by geographical areas
Europe1771,491 718,767
North America2186,115 163,461
Rest of world 49,001 68,064
TOTAL 1,006,607 950,292
1. Germany, France and the United Kingdom accounted for respectively 22%, 13% and 13% of our 2015 group revenue.
2. The North American revenue in 2015 is generated mainly in the United Stated of America.