TomTom 2015 Annual Report Download - page 93
Download and view the complete annual report
Please find page 93 of the 2015 TomTom annual report below. You can navigate through the pages in the report by either clicking on the pages listed below, or by using the keyword search tool below to find specific information within the annual report.-
 1
1 -
2
-
3
-
4
-
5
-
6
-
7
-
8
-
9
-
10
-
11
-
12
-
13
-
14
-
15
-
16
-
17
-
18
-
19
-
20
-
21
-
22
-
23
-
24
-
25
-
26
-
27
-
28
-
29
-
30
-
31
-
32
-
33
-
34
-
35
-
36
-
37
-
38
-
39
-
40
-
41
-
42
-
43
-
44
-
45
-
46
-
47
-
48
-
49
-
50
-
51
-
52
-
53
-
54
-
55
-
56
-
57
-
58
-
59
-
60
-
61
-
62
-
63
-
64
-
65
-
66
-
67
-
68
-
69
-
70
-
71
-
72
-
73
-
74
-
75
-
76
-
77
-
78
-
79
-
80
-
81
-
82
-
 83
83 -
 84
84 -
 85
85 -
 86
86 -
 87
87 -
 88
88 -
 89
89 -
 90
90 -
 91
91 -
 92
92 -
 93
93 -
 94
94 -
 95
95 -
 96
96 -
 97
97 -
 98
98 -
 99
99 -
 100
100 -
 101
101 -
 102
102 -
 103
103 -
104
-
105
-
106
-
107
-
108
-
109
-
110
-
111
-
112
-
113
-
114
-
115
-
116
-
117
-
118
-
119
-
120
-
121
-
122
-
123
-
124
-
125
-
126
-
127
-
128
-
129
 |
 |

CONSOLIDATED FINANCIAL STATEMENTS
TOMTOM / ANNUAL REPORT AND ACCOUNTS 2015 / 92
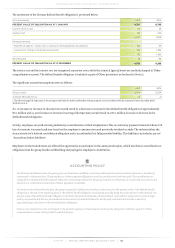
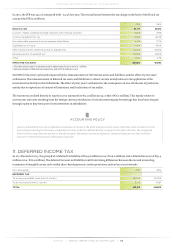
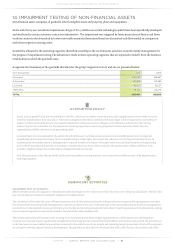
segments are presented in the table below. The input to the group's key assumptions include those that are based on non-observable market data (level
3 input in accordance with IFRS 13).
Consumer Automotive Licensing Telematics
2015
Revenue - perpetual growth10.0% 2.0% 0.0% 2.0%
Discount rate29.0% 9.0% 9.0% 9.0%
2014
Revenue - perpetual growth10.0% 2.0% 0.0% 2.0%
Discount rate29.5% 9.5% 9.5% 9.5%
1. Weighted average growth rate used to extrapolate cash flows beyond the forecasted period.
2. Post-tax discount rate applied to the cash flow projections.
Discount rates used are post-tax and reflect specific risks relating to the relevant operating segments. Management considered the effects of applying a
pre-tax approach and concluded that this will not materially change the outcome of the impairment test.
Expectations and input to the impairment calculation, as well as the overall outcome, have been compared with the available external information from
various analysts and to the extent available with market information on recent comparable transactions.
The impairment test performed resulted in no goodwill impairment for 2015 and 2014 for any of the segments. Management performed a sensitivity
analysis on the relevant key assumptions in the group's 2015 year-end annual impairment testing.
The sensitivity test for the Licensing segment showed that the level of headroom available at year-end 2015 (headroom: €27 million, 2014: €104
million) would fall to nil should the compound annual revenue growth rate in the forecasted period decrease from 3% to 2% and/or should the discount
rate increase from 9% to 10% while other factors remain constant.
For Consumer, Automotive and Telematics, a reasonably possible change in any of the above-mentioned key assumptions as well as other assumptions
in the forecasted period would not cause the fair value less costs of disposal of any of these units to fall below the level of their respective carrying value.
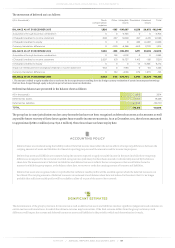
15. BUSINESS COMBINATIONS
2015
In 2015, the group made two acquisitions for an aggregate consideration of €42.4 million. This consideration includes cash
considerations as well as an estimated contingent consideration of €2.0 million, which has been determined based on certain
financial and non-financial key performance indicators. The acquisitions comprise of Location Navigation Pty. Ltd, a mapping
company in Australia on 30 April 2015 and Finder S.A., a leading Polish fleet management service provider on 23 December 2015. With
these acquisitions, we expanded our global map flootprint and our fleet management business.
Both acquisitions were effectuated through the acquisition of 100% of the shares. The main assets and liabilities that arose from both
acquisitions combined were intangible assets of €48.3 million, which includes €21.9 million goodwill and deferred tax liabilities of
€1.8 million. The fair value of the assets and liabilities acquired have been determined using discounted cash flow technique, which
includes inputs that are not based on observable market data (level 3 input). Given the timing of the Finder acquisition, the purchase
price allocation has been made based on provisional information at year-end. The acquired businesses contributed a revenue of
€2.9 million and a net profit of €1.7 million in 2015. Excluding the impact of the acquisition-related amortisation from the purchase
price allocations, the contributed result in 2015 was a net profit of €2.2 million. If the group had acquired all companies from 1 January
2015, the group revenue and net result for 2015 would have been €1,023.6 million and €18.8 million respectively. The acquisition of
Finder added over 60,000 subscribers to our Telematics subscriber installed base.
As none of the transactions are material individually, they are not disclosed separately in accordance with IFRS 3.
2014
In 2014, the group made several acquisitions for an aggregate consideration of €22.0 million. This consideration includes cash
considerations as well as an estimate of contingent consideration, which has been determined based on certain financial and
nonfinancial key performance indicators. The main acquisitions were the acquisitions of DAMS Tracking in France on 1 June 2014 and
Fleetlogic in the Netherlands on 1 December 2014. Both companies are fleet management service providers which in aggregate added
approximately 54,000 subscribers to our Telematics subscriber installed base.