TomTom 2015 Annual Report Download - page 124
Download and view the complete annual report
Please find page 124 of the 2015 TomTom annual report below. You can navigate through the pages in the report by either clicking on the pages listed below, or by using the keyword search tool below to find specific information within the annual report.-
 1
1 -
2
-
3
-
4
-
5
-
6
-
7
-
8
-
9
-
10
-
11
-
12
-
13
-
14
-
15
-
16
-
17
-
18
-
19
-
20
-
21
-
22
-
23
-
24
-
25
-
26
-
27
-
28
-
29
-
30
-
31
-
32
-
33
-
34
-
35
-
36
-
37
-
38
-
39
-
40
-
41
-
42
-
43
-
44
-
45
-
46
-
47
-
48
-
49
-
50
-
51
-
52
-
53
-
54
-
55
-
56
-
57
-
58
-
59
-
60
-
61
-
62
-
63
-
64
-
65
-
66
-
67
-
68
-
69
-
70
-
71
-
72
-
73
-
74
-
75
-
76
-
77
-
78
-
79
-
80
-
81
-
82
-
83
-
84
-
85
-
86
-
87
-
88
-
89
-
90
-
91
-
92
-
93
-
94
-
95
-
96
-
97
-
98
-
99
-
100
-
101
-
102
-
103
-
104
-
105
-
106
-
107
-
108
-
109
-
110
-
111
-
112
-
113
-
 114
114 -
 115
115 -
 116
116 -
 117
117 -
 118
118 -
 119
119 -
 120
120 -
 121
121 -
 122
122 -
 123
123 -
 124
124 -
 125
125 -
 126
126 -
 127
127 -
 128
128 -
 129
129
 |
 |

SUPPLEMENTARY INFORMATION
TOMTOM / ANNUAL REPORT AND ACCOUNTS 2015 / 123
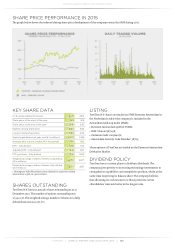
SHARE PRICE PERFORMANCE IN 2015
The graph below shows the indexed closing share price development of the company versus the AMX during 2015.
KEY SHARE DATA
(in €, unless stated otherwise) 2015 2014
Share price at the start of the year 5.53 5.15
Share price at the end of the year 11.61 5.53
Highest closing share price 12.29 6.62
Lowest closing share price 5.30 4.34
Market capitalisation at year end (€ in millions) 2,674 1,236
Average daily volume traded (# in thousands) 2,141 1,105
EPS - fully diluted 0.08 0.10
Adjusted EPS - fully diluted10.21 0.27
FCF per share - fully diluted -0.15 0.05
Weighted average number of shares outstanding
(# in millions) 227.8 222.7
Weighted average number of shares fully diluted
(# in millions) 232.4 225.1
1. Earnings per fully diluted share count adjusted for acquisition-related
amortisation & gain on a post-tax basis.
SHARES OUTSTANDING
TomTom N.V. had 230,495,981 shares outstanding as at 31
December 2015. The number of options outstanding was
10,532,136. The weighted average number of shares on a fully
diluted basis was 232,377,771.
LISTING
TomTom N.V. shares are traded on NYSE Euronext Amsterdam in
the Netherlands, where the company is included in the
Amsterdam Mid-Cap Index (AMX):
Euronext Amsterdam symbol: TOM2;
●
ISIN: NL0000387058;
●
Common Code: 021984272;
●
Amsterdam Security Code Number: 38705;
●
Share options of TomTom are traded on the Euronext Amsterdam
Derivative Market.
DIVIDEND POLICY
TomTom has no current plans to distribute dividends. The
company gives priority to increasing technology investments to
strengthen its capabilities and competitive position, whilst at the
same time improving its balance sheet. The company believes
that allocating its cash resources to these priorities, serves
shareholders' interests better in the longer term.