TomTom 2015 Annual Report Download - page 85
Download and view the complete annual report
Please find page 85 of the 2015 TomTom annual report below. You can navigate through the pages in the report by either clicking on the pages listed below, or by using the keyword search tool below to find specific information within the annual report.-
 1
1 -
2
-
3
-
4
-
5
-
6
-
7
-
8
-
9
-
10
-
11
-
12
-
13
-
14
-
15
-
16
-
17
-
18
-
19
-
20
-
21
-
22
-
23
-
24
-
25
-
26
-
27
-
28
-
29
-
30
-
31
-
32
-
33
-
34
-
35
-
36
-
37
-
38
-
39
-
40
-
41
-
42
-
43
-
44
-
45
-
46
-
47
-
48
-
49
-
50
-
51
-
52
-
53
-
54
-
55
-
56
-
57
-
58
-
59
-
60
-
61
-
62
-
63
-
64
-
65
-
66
-
67
-
68
-
69
-
70
-
71
-
72
-
73
-
74
-
 75
75 -
 76
76 -
 77
77 -
 78
78 -
 79
79 -
 80
80 -
 81
81 -
 82
82 -
 83
83 -
 84
84 -
 85
85 -
 86
86 -
 87
87 -
 88
88 -
 89
89 -
 90
90 -
 91
91 -
 92
92 -
 93
93 -
 94
94 -
 95
95 -
96
-
97
-
98
-
99
-
100
-
101
-
102
-
103
-
104
-
105
-
106
-
107
-
108
-
109
-
110
-
111
-
112
-
113
-
114
-
115
-
116
-
117
-
118
-
119
-
120
-
121
-
122
-
123
-
124
-
125
-
126
-
127
-
128
-
129
 |
 |

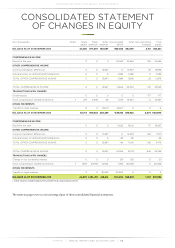
CONSOLIDATED FINANCIAL STATEMENTS
TOMTOM / ANNUAL REPORT AND ACCOUNTS 2015 / 84
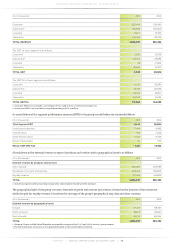
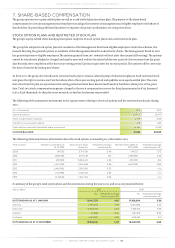
The fair value of the stock options granted was determined using the binomial tree model. This model contains the input variables,
including the risk-free interest rate, volatility of the underlying share price, exercise price and share price at the date of grant. The fair
value calculated is allocated on a straight-line basis over the vesting period, based on the group's estimate of equity instruments that
will eventually vest.
2015 2014
Share price at grant date (€) 7.60 5.28
Exercise price (€) 7.60-7.83 4.93-5.28
Expected volatility 42% 45%
Expected average option life in years 5.3 5.3
Weighted average risk-free rate 0.60% 0.98%
Expected dividends Zero Zero
The option valuation models require the input of highly subjective assumptions, including the expected stock price volatility.
Volatility is determined using industry benchmarking for listed peer group companies as well as the historic volatility of the TomTom
NV's stock. The group's employee stock options have characteristics that are significantly different from those of traded options, and
changes in the subjective input assumptions can affect the fair value estimate.
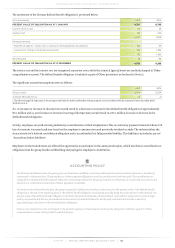
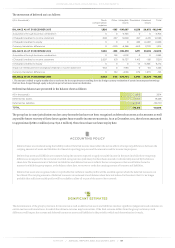
PHANTOM SHARE PLAN
The existing phantom share plan was introduced in 2011. Under this plan, eligible employees are entitled to receive a cash payment
equal to the value of the number of shares that have vested. These cash-settled phantom shares are conditional on the employee
completing three years of service (the vesting period). On 31 December 2015, the outstanding liability with regard to the phantom
share plan was €18.4 million (2014: €8.0 million).
The following table provides the movement in the number of phantom shares.
2015 2014
OUTSTANDING AS AT 1 JANUARY 2,994,330 2,356,730
Vested and paid out -769,100 -393,300
Granted 850,350 1,235,855
Forfeited -264,080 -204,955
OUTSTANDING AS AT 31 DECEMBER 2,811,500 2,994,330
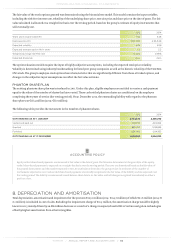
ACCOUNTING POLICY
Equity-settled share-based payments are measured at fair value at the date of grant. The fair value determined at the grant date of the equity-
settled share-based payments is expensed on a straight-line basis over the vesting period. The costs are determined based on the fair value of
the granted instruments and the number expected to vest. At each balance sheet date, the group revises its estimates of the number of
instruments expected to vest. Cash-settled share-based payments are initially recognised at the fair value of the liability and are expensed over
the vesting period. The liability is remeasured at each balance sheet date to its fair value, with all changes recognised immediately as either a
profit or a loss.
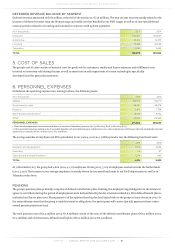
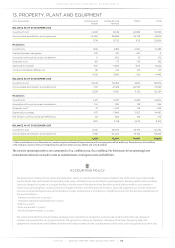
8. DEPRECIATION AND AMORTISATION
Total depreciation, amortisation and impairment for the year was €123.1 million (2014: €114.7 million) of which €21.6 million (2014: €
6.1 million) is included in cost of sales. Excluding the impairment charge of €11.5 million, the amortisation charge would be slightly
lower in 2015 mainly driven by an €8 million decrease as a result of a change in expected useful life of certain navigation technologies
offset by higher amortisation from other intangibles.