Qantas 2005 Annual Report Download - page 87
Download and view the complete annual report
Please find page 87 of the 2005 Qantas annual report below. You can navigate through the pages in the report by either clicking on the pages listed below, or by using the keyword search tool below to find specific information within the annual report.-
 1
1 -
2
-
3
-
4
-
5
-
6
-
7
-
8
-
9
-
10
-
11
-
12
-
13
-
14
-
15
-
16
-
17
-
18
-
19
-
20
-
21
-
22
-
23
-
24
-
25
-
26
-
27
-
28
-
29
-
30
-
31
-
32
-
33
-
34
-
35
-
36
-
37
-
38
-
39
-
40
-
41
-
42
-
43
-
44
-
45
-
46
-
47
-
48
-
49
-
50
-
51
-
52
-
53
-
54
-
55
-
56
-
57
-
58
-
59
-
60
-
61
-
62
-
63
-
64
-
65
-
66
-
67
-
68
-
69
-
70
-
71
-
72
-
73
-
74
-
75
-
76
-
 77
77 -
 78
78 -
 79
79 -
 80
80 -
 81
81 -
 82
82 -
 83
83 -
 84
84 -
 85
85 -
 86
86 -
 87
87 -
 88
88 -
 89
89 -
 90
90 -
 91
91 -
 92
92 -
 93
93 -
 94
94 -
 95
95 -
 96
96 -
 97
97 -
98
-
99
-
100
-
101
-
102
-
103
-
104
-
105
-
106
-
107
-
108
-
109
-
110
-
111
-
112
-
113
-
114
-
115
-
116
-
117
-
118
-
119
-
120
-
121
-
122
-
123
-
124
-
125
-
126
-
127
-
128
 |
 |

85
Qantas Annual Report 2005
~Notes to the Financial Statements~
for the year ended 30 June 2005
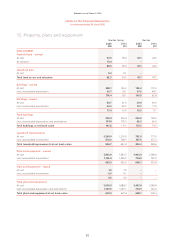
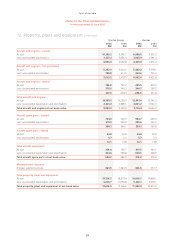
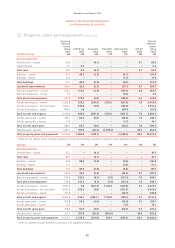
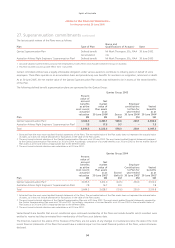
12. Property, plant and equipment continued
Qantas Group
Opening
Written
Down
Value
2005
$M
Additions
2005
$M
Disposals
2005
$M
Transfers
2005
$M
Depreciation
2005
$M
Other*
2005
$M
Closing
Written
Down
Value
2005
$M
RECONCILIATIONS
Freehold land – owned 59.4 –(0.1) – – 8.768.0
Leasehold land 0.1 0.2 – – – – 0.3
Total land 59.5 0.2 (0.1) – – 8.7 68.3
Buildings – owned 92.1 89.5 (0.5) – (6.7) – 174.4
Buildings – leased 19.0 –––(1.6)–17.4
Total buildings 111.1 89.5 (0.5) – (8.3) – 191.8
Leasehold improvements 623.4 23.6 (2.7) – (57.7) 8.1 594.7
Plant and equipment – owned 626.5 178.2 (6.9) – (134.9) 6.6 669.5
Plant and equipment – leased 0.9 –––(0.4)–0.5
Total plant and equipment 627.4 178.2 (6.9) – (135.3) 6.6 670.0
Aircraft and engines – owned 6,562.8 158.2 (287.4) 1,159.2 (657.6) 7.8 6,943.0
Aircraft and engines – hire purchased 2,402.1 249.8 (2.9) – (135.8) – 2,513.2
Aircraft and engines – leased 404.9 1.0––(38.1)–367.8
Total aircraft and engines 9,369.8 409.0 (290.3) 1,159.2 (831.5) 7.8 9,824.0
Aircraft spare parts – owned 366.1 64.5 (5.0) – (48.5) 7.0 384.1
Aircraft spare parts – leased 17.8 –––(1.7)–16.1
Total aircraft spare parts 383.9 64.5 (5.0) – (50.2) 7.0 400.2
Manufacturers’ deposits 1,081.5 917.9 (26.6) (1,159.2) – 49.9 863.5
Total property, plant and equipment 12,256.6 1,682.9 (332.1) – (1,083.0) 88.1 12,612.5
* Other for the Qantas Group includes revaluation of land and buildings, transfers to inventory and capitalised interest.
Qantas $M $M $M $M $M $M $M
RECONCILIATIONS
Freehold land – owned 47.2 –(0.1) – – –47.1
Total land 47.2 –(0.1) – – –47.1
Buildings – owned 62.4 89.5 (0.5) – (4.6) – 146.8
Buildings – leased 11.1 – – – (0.8) – 10.3
Total buildings 73.5 89.5 (0.5) – (5.4) – 157.1
Leasehold improvements 399.6 23.0 (2.4) – (33.0) 8.1 395.3
Plant and equipment – owned 576.4 153.3 (6.1) (1.9) (121.1) 7.5 608.1
Total plant and equipment 576.4 153.3 (6.1) (1.9) (121.1) 7.5 608.1
Aircraft and engines – owned 3,951.4 0.8 (281.3) 1,145.8 (500.8) 9.1 4,325.0
Aircraft and engines – hire purchased 4,422.8 353.9 (2.8) – (231.3) – 4,542.6
Aircraft and engines – leased 271.8 –––(23.0)–248.8
Total aircraft and engines 8,646.0 354.7 (284.1 ) 1.145.8 (755.1) 9.1 9,116.4
Aircraft spare parts – owned 300.8 36.5 (5.0) – (42.9) 9.7 299.1
Aircraft spare parts – leased 17.8 –––(1.7)–16.1
Total aircraft spare parts 318.6 36.5 (5.0) – (44.6) 9.7 315.2
Manufacturers’ deposits 611.7 557.8 (26.6) (590.0) – 49.9 602.8
Total property, plant and equipment 10,673.0 1,214.8 (324.8) 553.9 (959.2) 84.3 11,242.0
* Other for Qantas includes transfers to inventory and capitalised interest.