Qantas 2005 Annual Report Download - page 124
Download and view the complete annual report
Please find page 124 of the 2005 Qantas annual report below. You can navigate through the pages in the report by either clicking on the pages listed below, or by using the keyword search tool below to find specific information within the annual report.-
 1
1 -
2
-
3
-
4
-
5
-
6
-
7
-
8
-
9
-
10
-
11
-
12
-
13
-
14
-
15
-
16
-
17
-
18
-
19
-
20
-
21
-
22
-
23
-
24
-
25
-
26
-
27
-
28
-
29
-
30
-
31
-
32
-
33
-
34
-
35
-
36
-
37
-
38
-
39
-
40
-
41
-
42
-
43
-
44
-
45
-
46
-
47
-
48
-
49
-
50
-
51
-
52
-
53
-
54
-
55
-
56
-
57
-
58
-
59
-
60
-
61
-
62
-
63
-
64
-
65
-
66
-
67
-
68
-
69
-
70
-
71
-
72
-
73
-
74
-
75
-
76
-
77
-
78
-
79
-
80
-
81
-
82
-
83
-
84
-
85
-
86
-
87
-
88
-
89
-
90
-
91
-
92
-
93
-
94
-
95
-
96
-
97
-
98
-
99
-
100
-
101
-
102
-
103
-
104
-
105
-
106
-
107
-
108
-
109
-
110
-
111
-
112
-
113
-
 114
114 -
 115
115 -
 116
116 -
 117
117 -
 118
118 -
 119
119 -
 120
120 -
 121
121 -
 122
122 -
 123
123 -
 124
124 -
 125
125 -
 126
126 -
 127
127 -
 128
128
 |
 |

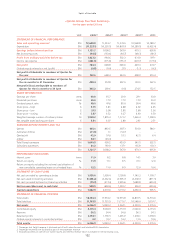
122
Unit 20051,2 20041,2 20031,2 20021,2 2001
STATEMENT OF FINANCIAL PERFORMANCE
Sales and operating revenue3$M 12,648.8 11,353.7 11,374.9 10,968.8 10,188. 2
Expenditure $M (11,527.1) (10,255.5) (10,807.9) (10,289.5) (9,492.4)
Earnings before interest and tax $M 1,121.7 1,098.2 567.0 679.3 695.8
Net borrowing costs $M (94.5) (133.6) (64.7) (48.3) (98.7)
Profit from ordinary activities before tax $M 1,027.2 964.6 502.3 631.0 597.1
Income tax expense $M (262.8) (315.8) (155.7) (201.7) (177.4)
Net profit $M 764.4 648.8 346.6 429.3 419.7
Outside equity interests in net (profit) $M (0.8) (0.4) (3.1) (1.3) (4.3)
Net profit attributable to members of Qantas for
the year $M 763.6 648.4 343.5 428.0 415.4
Net profit attributable to members of Qantas for
the six months to 31 December $M 458.4 357.8 352.5 153.5 262.9
Net profit/(loss) attributable to members of
Qantas for the six months to 30 June $M 305.2 290.6 (9.0) 274.5 152.5
SHARE INFORMATION
Earnings per share cents 40.8 35.7 20.0 29.1 33.0
Dividends per share cents 20.0 17.0 17.0 17.0 20.0
Dividend payout ratio % 49.0 47.6 85.0 58.4 60.6
Share price – high $ 3.73 3.81 4.88 4.92 4.25
Share price – low $ 3.13 3.08 2.85 2.60 2.36
Share price – closing $ 3.37 3.52 3.27 4.60 3.50
Weighted average number of ordinary shares M 1,869.2 1,815.4 1,721.2 1,469.4 1,258.5
Net tangible asset backing per share $ 3.31 3.07 2.89 2.61 2.51
EARNINGS BEFORE INTEREST AND TAX
Qantas $M 965.1 863.5 387.3 501.0 586.1
Australian Airlines $M (11.6) 1.1 (14.7) – –
QantasLink $M 42.9 97.0 57.3 42.5 6.4
Jetstar $M 44.1 (23.4)–––
Total flying businesses $M 1,040.5 938.2 429.9 543.5 592.5
Subsidiary businesses $M 81.2 160.0 137.1 135.8 103.3
$M 1,121.7 1,098.2 567.0 679.3 695.8
PERFORMANCE INDICATORS
Interest cover times 11.9 8.2 8.8 14.1 7.0
Return on equity % 11.9 11.1 6.5 10.1 12.6
Return on equity including the notional capitalisation of
non-cancellable operating leases on a hedged basis % 13.2 11.0 8.9 12.0 10.6
STATEMENT OF CASH FLOWS
Net cash provided by operating activities $M 1,950.0 1,999.4 1,290.8 1,143.3 1,100.7
Net cash used in investing activities $M (1,396.2) (2,232.6) (2,995.7) (2,306.1) (871.3)
Net cash provided by/(used in) financing activities $M (15.3) (417.4) 2,935.6 1,688.8 (659.0)
Net increase/(decrease) in cash held $M 538.5 (650.6) 1,230.7 526.0 (429.6)
Capital expenditure $M 1,682.9 2,007.0 3,137.2 2,463.4 995.5
STATEMENT OF FINANCIAL POSITION
Total assets $M 18,134.4 17,574.2 16,973.8 14,801.5 12,513.6
Total liabilities $M 11,707.5 11,733.9 11,711.7 10,5 4 8 .0 9,197.7
Net assets $M 6,426.9 5,840.3 5,262.1 4,253.5 3,315.9
Contributed equity $M 4,173.4 3,994.9 3,757.9 2,946.6 2,173.0
Reserves $M 56.2 54.4 54.0 56.3 54.3
Retained profits $M 2,193.1 1,776.3 1,435.9 1,239.1 1,078.0
Outside equity interests in controlled entities $M 4.2 14.7 14.3 11.5 10.6
Total equity $M 6,426.9 5,840.3 5,262.1 4,253.5 3,315.9
1 Passenger and freight revenue is disclosed net of both sales discount and interline/IATA commission.
2 Passenger recoveries are disclosed as part of net passenger revenue.
3 Excludes proceeds on sale of non-current assets and interest revenue which is included in net borrowing costs.
Spirit of Australia
~Qantas Group Five-Year Summary~
for the years ended 30 June