Qantas 2005 Annual Report Download - page 43
Download and view the complete annual report
Please find page 43 of the 2005 Qantas annual report below. You can navigate through the pages in the report by either clicking on the pages listed below, or by using the keyword search tool below to find specific information within the annual report.-
 1
1 -
2
-
3
-
4
-
5
-
6
-
7
-
8
-
9
-
10
-
11
-
12
-
13
-
14
-
15
-
16
-
17
-
18
-
19
-
20
-
21
-
22
-
23
-
24
-
25
-
26
-
27
-
28
-
29
-
30
-
31
-
32
-
 33
33 -
 34
34 -
 35
35 -
 36
36 -
 37
37 -
 38
38 -
 39
39 -
 40
40 -
 41
41 -
 42
42 -
 43
43 -
 44
44 -
 45
45 -
 46
46 -
 47
47 -
 48
48 -
 49
49 -
 50
50 -
 51
51 -
 52
52 -
 53
53 -
54
-
55
-
56
-
57
-
58
-
59
-
60
-
61
-
62
-
63
-
64
-
65
-
66
-
67
-
68
-
69
-
70
-
71
-
72
-
73
-
74
-
75
-
76
-
77
-
78
-
79
-
80
-
81
-
82
-
83
-
84
-
85
-
86
-
87
-
88
-
89
-
90
-
91
-
92
-
93
-
94
-
95
-
96
-
97
-
98
-
99
-
100
-
101
-
102
-
103
-
104
-
105
-
106
-
107
-
108
-
109
-
110
-
111
-
112
-
113
-
114
-
115
-
116
-
117
-
118
-
119
-
120
-
121
-
122
-
123
-
124
-
125
-
126
-
127
-
128
 |
 |

41
Qantas Annual Report 2005
~Discussion and Analysis of Performance Summary~
for the year ended 30 June 2005
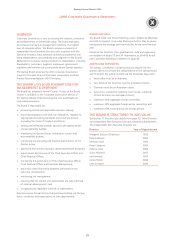
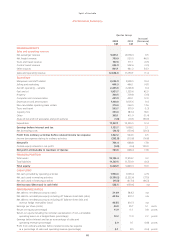
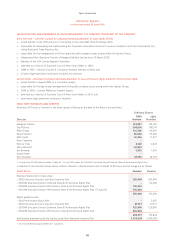
STATEMENT OF FINANCIAL PERFORMANCE
for the year ended 30 June 2005
Unit
Qantas Group Increase/
(Decrease)
%
2005 2004
QANTAS GROUP OPERATIONAL STATISTICS
AND PERFORMANCE INDICATORS*
Passengers carried 000 32,658 30,076 8.6
Revenue passenger kilometres (RPKs) M 86,986 81,276 7.0
Available seat kilometres (ASKs) M 114,003 104,200 9.4
Revenue seat factor % 76.3 78.0 (1.7) points
Passenger yield (passenger revenue per RPK) cents 10.64 10.46 1.7
Average full-time equivalent employees # 35,520 33,862 4.9
Aircraft in service at balance date # 200 190 10 aircraft
Return on total revenue % 6.0 5.7 0.3 points
Return on equity % 11.9 11.1 0. 8 point s
* A glossary of terms appears on page 124.
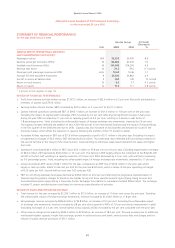
REVIEW OF FINANCIAL PERFORMANCE
x Profit from ordinary activities before tax was $1,027.2 million, an increase of $62.6 million or 6.5 per cent. Net profit attributable to
members of Qantas was $763.6 million.
x Earnings before interest and tax (EBIT) increased by $23.5 million or 2.1 per cent to $1,121.7 million.
x Qantas mainline operations contributed EBIT of $965.1 million, an increase of $101.6 million or 11.8 per cent on the prior year.
Excluding the impact of segmentation recharges, EBIT increased by 0.3 per cent reflecting the significant increase in fuel prices
during the year. RPKs increased by 2.1 per cent on capacity growth of 4.4 per cent, resulting in a decline in seat factor of
1.8 percentage points. Yield, excluding the unfavourable impact of foreign exchange rate movements, improved by 2.6 per cent.
The capacity increase reflected the addition of new A330-300 aircraft in the international business and the impact of reduced flying
in the first quarter of the 2003/04 year due to SARS. Capacity was also increased on key business and long-sector routes in the
domestic market, which offset the reduction in capacity following the transfer of the 717 aircraft to Jetstar.
x Australian Airlines reported an EBIT loss of $11.6 million compared to a profit of $1.1 million in the prior year. Excluding the impact
of segmentation charges of $9.3 million, EBIT declined by $3.4 million. This underlying result reflected difficult trading conditions in
the second half due to the impact of the Asian tsunami, travel warnings to Indonesia, weak leisure demand from Japan and higher
fuel costs.
x QantasLink contributed $42.9 million in EBIT, down $54.1 million or 55.8 per cent on the prior year. Excluding segmentation recharges
of $44.3 million, EBIT declined by $9.8 million or 10.1 per cent. The decline in EBIT largely reflects the retirement of five BAe146-100
aircraft in the first half, resulting in a capacity reduction of 3.4 per cent. RPKs decreased by 2.7 per cent, with seat factor improving
by 0.5 percentage points. Yield, excluding the unfavourable impact of foreign exchange rate movements, improved by 1.7 per cent.
x Jetstar recorded an EBIT result of $44.1 million for the year, compared to an EBIT loss of $23.4 million in the prior year whilst
largely in start-up mode. Jetstar’s total cost per ASK for the year was 8.00 cents, which is below its full year operating cost target
of 8.25 cents per ASK. Second-half unit cost was 7.62 cents per ASK.
x EBIT for non-flying subsidiary businesses declined by $78.8 million or 49.2 per cent reflecting the progressive implementation of
financial reporting system changes to transition the Qantas Group into three separate business types (Flying, Flying Services and
Associated Businesses) supported by a Corporate Centre. Recharges from Qantas to subsidiaries totalled $98.6 million. The recharges
included IT, airport and distribution costs based on a more accurate allocation of activities.
REVIEW OF SALES AND OPERATING REVENUE
x Total revenue for the year increased by $1,295.1 million to $12.6 billion, an increase of 11.4 per cent versus the prior year. Excluding
the unfavourable impact of foreign exchange movements, revenue increased by $1,334.6 million or 11.8 per cent.
x Net passenger revenue increased by $856.8 million to $9.8 billion, an increase of 9.5 per cent. Excluding the unfavourable impact
of exchange rate movements, revenue increased by 9.8 per cent due to growth in RPKs of 7.0 per cent and an improvement in yield
(excluding exchange) of 2.0 per cent. Overall Qantas Group capacity (ASKs) increased by 9.4 per cent compared with the prior year.
x Other revenue categories increased by $438.3 million to $2.8 billion, an increase of 18.5 per cent. This was primarily due to additional
wet-leased freighter capacity, freight fuel surcharge, growth in outbound tours and travel, various service fees and charges and the
release of surplus revenue provisions of $52.1 million.