Qantas 2005 Annual Report Download - page 76
Download and view the complete annual report
Please find page 76 of the 2005 Qantas annual report below. You can navigate through the pages in the report by either clicking on the pages listed below, or by using the keyword search tool below to find specific information within the annual report.-
 1
1 -
2
-
3
-
4
-
5
-
6
-
7
-
8
-
9
-
10
-
11
-
12
-
13
-
14
-
15
-
16
-
17
-
18
-
19
-
20
-
21
-
22
-
23
-
24
-
25
-
26
-
27
-
28
-
29
-
30
-
31
-
32
-
33
-
34
-
35
-
36
-
37
-
38
-
39
-
40
-
41
-
42
-
43
-
44
-
45
-
46
-
47
-
48
-
49
-
50
-
51
-
52
-
53
-
54
-
55
-
56
-
57
-
58
-
59
-
60
-
61
-
62
-
63
-
64
-
65
-
 66
66 -
 67
67 -
 68
68 -
 69
69 -
 70
70 -
 71
71 -
 72
72 -
 73
73 -
 74
74 -
 75
75 -
 76
76 -
 77
77 -
 78
78 -
 79
79 -
 80
80 -
 81
81 -
 82
82 -
 83
83 -
 84
84 -
 85
85 -
 86
86 -
87
-
88
-
89
-
90
-
91
-
92
-
93
-
94
-
95
-
96
-
97
-
98
-
99
-
100
-
101
-
102
-
103
-
104
-
105
-
106
-
107
-
108
-
109
-
110
-
111
-
112
-
113
-
114
-
115
-
116
-
117
-
118
-
119
-
120
-
121
-
122
-
123
-
124
-
125
-
126
-
127
-
128
 |
 |

74
Spirit of Australia
~Notes to the Financial Statements~
for the year ended 30 June 2005
1. Statement of significant accounting policies continued
(y) INTEREST-BEARING LIABILITIES
Bank and other loans are recognised at their principal amount, subject to set-off arrangements. Interest expense is accrued at the
contracted rate and included in other creditors and accruals.
(z) USE AND REVISION OF ACCOUNTING ESTIMATES
The preparation of the Financial Report requires the making of estimates and assumptions that affect the recognised amounts of assets,
liabilities, revenues and expenses and the disclosure of contingent liabilities. The estimates and associated assumptions are based on
historical experience and various other factors that are believed to be reasonable under the circumstances, the results of which form the
basis of making judgements about carrying values of assets and liabilities that are not readily apparent from other sources. Actual results
may differ from these estimates.
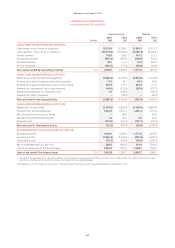
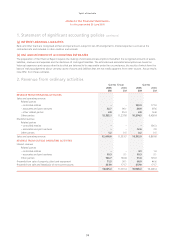
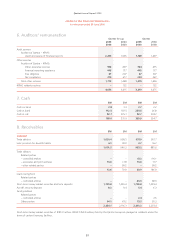
2. Revenue from ordinary activities
Qantas Group Qantas
2005
$M
2004
$M
2005
$M
2004
$M
REVENUE FROM OPERATING ACTIVITIES
Sales and operating revenue
Related parties
– controlled entities ––133.0 177.3
– associates and joint ventures 92.7 90.1 88.9 87.6
– other related parties 2.8 25.3 2.8 16.8
Other parties 12,552.1 11, 237.8 10,274.5 9,428.4
Dividend revenue
Related parties
– controlled entities –––156.3
– associates and joint ventures ––12.6 2.9
Other parties 1.2 0.5 0.2 0.5
Sales and operating revenue 12,648.8 11,353.7 10,512.0 9,869.8
REVENUE FROM OUTSIDE OPERATING ACTIVITIES
Interest revenue
Related parties
– controlled entities ––0.1 1.3
– associates and joint ventures 10.3 5.1 10.3 5.1
Other parties 106.7 120.8 91.0 105.9
Proceeds from sale of property, plant and equipment 71.5 50.1 66.9 46.6
Proceeds from sale and leaseback of non-current assets 257.9 171.7 257.9 171.7
13,095.2 11,701.4 10,938.2 10,200.4