Qantas 2005 Annual Report Download - page 44
Download and view the complete annual report
Please find page 44 of the 2005 Qantas annual report below. You can navigate through the pages in the report by either clicking on the pages listed below, or by using the keyword search tool below to find specific information within the annual report.-
 1
1 -
2
-
3
-
4
-
5
-
6
-
7
-
8
-
9
-
10
-
11
-
12
-
13
-
14
-
15
-
16
-
17
-
18
-
19
-
20
-
21
-
22
-
23
-
24
-
25
-
26
-
27
-
28
-
29
-
30
-
31
-
32
-
33
-
 34
34 -
 35
35 -
 36
36 -
 37
37 -
 38
38 -
 39
39 -
 40
40 -
 41
41 -
 42
42 -
 43
43 -
 44
44 -
 45
45 -
 46
46 -
 47
47 -
 48
48 -
 49
49 -
 50
50 -
 51
51 -
 52
52 -
 53
53 -
 54
54 -
55
-
56
-
57
-
58
-
59
-
60
-
61
-
62
-
63
-
64
-
65
-
66
-
67
-
68
-
69
-
70
-
71
-
72
-
73
-
74
-
75
-
76
-
77
-
78
-
79
-
80
-
81
-
82
-
83
-
84
-
85
-
86
-
87
-
88
-
89
-
90
-
91
-
92
-
93
-
94
-
95
-
96
-
97
-
98
-
99
-
100
-
101
-
102
-
103
-
104
-
105
-
106
-
107
-
108
-
109
-
110
-
111
-
112
-
113
-
114
-
115
-
116
-
117
-
118
-
119
-
120
-
121
-
122
-
123
-
124
-
125
-
126
-
127
-
128
 |
 |
42
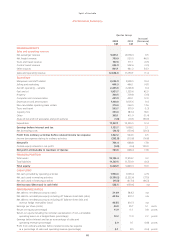
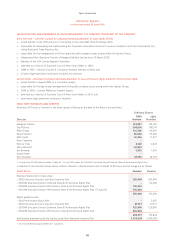
REVIEW OF EXPENDITURE
x Total expenditure, including net borrowing costs, increased by $1,232.5 million or 11.9 per cent to $11.6 billion. Excluding the
favourable impact of movements in foreign exchange rates, total expenditure increased by $1,363.5 million or 13.1 per cent.
Excluding fuel and oil price increases of $484.9 million, expenditure increased by $747.6 million or 7.2 per cent, which was lower
than the 9.4 per cent increase in capacity. This outcome reflects cost saving initiatives delivered under the Sustainable Future Program
and favourable foreign exchange movements of $34.1 million.
x Net expenditure cost per ASK, excluding the favourable impact of foreign exchange rate movements, increased by 1.2 per cent.
After eliminating the impact of unfavourable fuel and oil cost movements, unit costs improved by 5.8 per cent.
x Manpower and staff related expenditure increased by $306.4 million or 10.4 per cent. This included Enterprise Bargaining Agreement
wage increases of 3.0 per cent and a 4.9 per cent increase in average full-time equivalent employees. The result also includes the
provision of executive and staff bonuses following the achievement of profitability targets for the year.
x Selling and marketing expenditure decreased by $21.8 million or 4.7 per cent largely due to lower advertising costs and favourable
foreign exchange. The prior year included expenditure on the Rugby World Cup, Skybed, “I Still Call Australia Home” and the launch
of Jetstar.
x Aircraft operating variable costs increased by $209.0 million or 9.4 per cent. Excluding favourable foreign exchange, costs increased
by $226.6 million largely due to increased landing fees and route navigation charges, security charges and other operating costs.
x Fuel and oil costs increased by 42.5 per cent or $576.1 million. The underlying jet fuel price was 51.2 per cent higher than the prior
year, increasing costs by $770.4 million, while increased consumption increased costs by $188.0 million. Total hedging benefits of
$403.5 million were $285.5 million higher than the prior year and contributed to reduce the impact of the underlying fuel price rise
to $484.9 million. Favourable foreign exchange rate movements contributed to reduce costs by $96.8 million.
x Property costs decreased by $9.3 million or 3.0 per cent largely due to the reversal of a rental provision for the Canberra Hangar
following an agreement with Canberra Airport to permit QDS to utilise the hangar for the duration of the lease.
x Computer and communication costs increased by $52.8 million or 12.0 per cent. This included transition and implementation
costs associated with the replacement of the 30-year old Data Centre. Computer Reservation System (CRS) fees and IT project and
software maintenance costs were higher, offset by SFP benefits and favourable foreign exchange of $9.7 million.
x Depreciation and amortisation increased by $94.4 million or 9.4 per cent due to increased depreciation on aircraft acquisitions and
modifications and software, offset by reduced spares depreciation.
x Non-cancellable operating lease rentals increased by 17.6 per cent or $46.5 million mainly due to additional A320s operated by
Jetstar.
x Capacity hire costs increased by $53.6 million or 18.6 per cent. This was due to a combination of increased freighter costs,
reduced leased-in capacity and the return of three 737-300 aircraft. Favourable foreign exchange rate movements decreased costs
by $4.9 million.
x Other expenditure decreased by $46.8 million or 11.4 per cent, primarily as a result of lower contract work material costs, insurance
costs and consultancy costs.
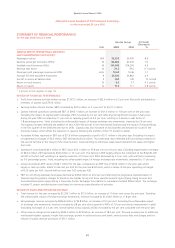
REVIEW OF OTHER PERFORMANCE SUMMARY ITEMS
x Net borrowing costs decreased by $39.1 million or 29.3 per cent, driven by lower average net debt and higher capitalised interest,
offset by lower interest income.
x The favourable net impact of foreign exchange rate movements on the overall profit before tax was $91.5 million.
x The effective tax rate decreased by 7.1 percentage points to 25.6 per cent, primarily due to a one-off tax credit as a result of tax
consolidation.
x Earnings per share increased by 5.1 cents to 40.8 cents. Diluted earnings per share increased by 5.2 cents to 40.7 cents.
Spirit of Australia
~Discussion and Analysis of Performance Summary~