Qantas 2005 Annual Report Download - page 117
Download and view the complete annual report
Please find page 117 of the 2005 Qantas annual report below. You can navigate through the pages in the report by either clicking on the pages listed below, or by using the keyword search tool below to find specific information within the annual report.-
 1
1 -
2
-
3
-
4
-
5
-
6
-
7
-
8
-
9
-
10
-
11
-
12
-
13
-
14
-
15
-
16
-
17
-
18
-
19
-
20
-
21
-
22
-
23
-
24
-
25
-
26
-
27
-
28
-
29
-
30
-
31
-
32
-
33
-
34
-
35
-
36
-
37
-
38
-
39
-
40
-
41
-
42
-
43
-
44
-
45
-
46
-
47
-
48
-
49
-
50
-
51
-
52
-
53
-
54
-
55
-
56
-
57
-
58
-
59
-
60
-
61
-
62
-
63
-
64
-
65
-
66
-
67
-
68
-
69
-
70
-
71
-
72
-
73
-
74
-
75
-
76
-
77
-
78
-
79
-
80
-
81
-
82
-
83
-
84
-
85
-
86
-
87
-
88
-
89
-
90
-
91
-
92
-
93
-
94
-
95
-
96
-
97
-
98
-
99
-
100
-
101
-
102
-
103
-
104
-
105
-
106
-
 107
107 -
 108
108 -
 109
109 -
 110
110 -
 111
111 -
 112
112 -
 113
113 -
 114
114 -
 115
115 -
 116
116 -
 117
117 -
 118
118 -
 119
119 -
 120
120 -
 121
121 -
 122
122 -
 123
123 -
 124
124 -
 125
125 -
 126
126 -
 127
127 -
128
 |
 |

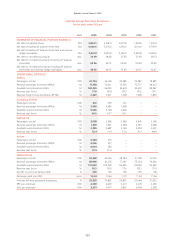
115
Qantas Annual Report 2005
~Notes to the Financial Statements~
for the year ended 30 June 2005
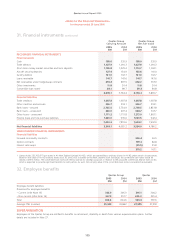
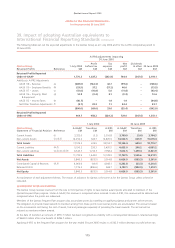
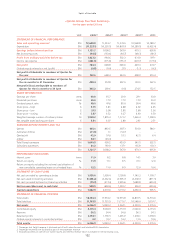
39. Impact of adopting Australian equivalents to
International Financial Reporting Standards continued
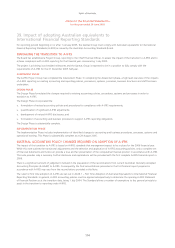
The following tables set out the expected adjustments to the Qantas Group as at 1 July 2004 and for the A-IFRS comparative period to
30 June 2005.
Qantas Group
Retained Profits Reference
1 July 2004
$M
A-IFRS adjustments impacting
30 June 2005
Dividends
& other
$M
30 June 2005
$M
Profit
before tax
$M
Tax
expense
$M
Net
profit
$M
Retained Profits Reported
Under A-GAAP 1,776.3 1,027.2 (262.8) 764.4 (347.6) 2,193.1
Add/(Less): A-IFRS Adjustments
AASB 118 – Revenue (a) (669.0) (142.3) 42.7 (99.6) – (768.6)
AASB 119 – Employee Benefits (b) (53.5) 57.2 (17.2) 40.0 – (13.5)
AASB 117 – Leases (c) (51.6) (16.8) 5.0 (11.8) – (63.4)
AASB 116 – Property, Plant
& Equipment
(d) 14.9 (0.4) 0.1 (0.3) – 14.6
AASB 112 – Income Taxes (e) (46.7) – 1.9 1.9 – (44.8)
Net Other Transition Adjustments
(f) (0.7) 33.3 1.1 34.4 – 33.7
(806.6) (69.0) 33.6 (35.4) – (842.0)
Retained Profits Reported
Under A-IFRS 969.7 958.2 (229.2) 729.0 (347.6) 1,351.1
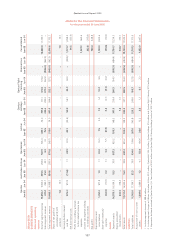
Qantas Group
Statement of Financial Position Reference
1 July 2004 30 June 2005
A-GAAP
$M
Transition
$M
A-IFRS
$M
A-GAAP
$M
Transition
$M
A-IFRS
$M
Current Assets (f) 3,322.0 (5.2) 3,316.8 3,709.9 (5.6) 3,704.3
Non-current Assets (c),(d),(f) 14,252.2 624.7 14,876.9 14,424.5 645.9 15,070.4
Total Assets 17,574.2 619.5 18,193.7 18,134.4 640.3 18,774.7
Current Liabilities (a),(f) 5,190.2 230.3 5,420.5 4,635.0 246.2 4,881.2
Non-current Liabilities (a),(b),(c),(d),(e) 6,543.7 1,214.7 7,758.4 7,072.5 1,259.4 8,331.9
Total Liabilities 11,733.9 1,445.0 13,178.9 11,707.5 1,505.6 13,213.1
Net Assets 5,840.3 (825.5) 5,014.8 6,426.9 (865.3) 5,561.6
Contributed Capital & Reserves (d),(f) 4,064.0 (18.9) 4,045.1 4,233.8 (23.3) 4,210.5
Retained Profits 1,776.3 (806.6) 969.7 2,193.1 (842.0) 1,351.1
Net Equity 5,840.3 (825.5) 5,014.8 6,426.9 (865.3) 5,561.6
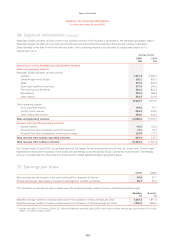
An explanation of each adjustment follows. The impact of adoption for Qantas is the same as for the Qantas Group unless otherwise
indicated.
(a) FREQUENT FLYER ACCOUNTING
The Qantas Group receives revenue from the sale to third parties of rights to have Qantas award points allocated to members of the
Qantas Frequent Flyer program. Under A-GAAP, this revenue is recognised when received. Under A-IFRS, this revenue will be deferred and
recognised when the points are redeemed.
Members of the Qantas Frequent Flyer program also accumulate points by travelling on qualifying Qantas and partner airline services.
The obligation to provide travel rewards to members arising from these points is accrued as points are accumulated. The accrual is based
on the incremental cost (being the cost of meals, fuel and passenger expenses) of providing the travel rewards. The accrual will be
reduced as members redeem awards.
At the date of transition an amount of $955.7 million has been recognised as a liability with a consequential decrease in retained earnings
of $669.0 million after a tax benefit of $286.7 million.
Applying A-IFRS to the Frequent Flyer program for the year ended 30 June 2005 results in a $142.3 million decrease in profit before tax.