Qantas 2005 Annual Report Download - page 102
Download and view the complete annual report
Please find page 102 of the 2005 Qantas annual report below. You can navigate through the pages in the report by either clicking on the pages listed below, or by using the keyword search tool below to find specific information within the annual report.-
 1
1 -
2
-
3
-
4
-
5
-
6
-
7
-
8
-
9
-
10
-
11
-
12
-
13
-
14
-
15
-
16
-
17
-
18
-
19
-
20
-
21
-
22
-
23
-
24
-
25
-
26
-
27
-
28
-
29
-
30
-
31
-
32
-
33
-
34
-
35
-
36
-
37
-
38
-
39
-
40
-
41
-
42
-
43
-
44
-
45
-
46
-
47
-
48
-
49
-
50
-
51
-
52
-
53
-
54
-
55
-
56
-
57
-
58
-
59
-
60
-
61
-
62
-
63
-
64
-
65
-
66
-
67
-
68
-
69
-
70
-
71
-
72
-
73
-
74
-
75
-
76
-
77
-
78
-
79
-
80
-
81
-
82
-
83
-
84
-
85
-
86
-
87
-
88
-
89
-
90
-
91
-
 92
92 -
 93
93 -
 94
94 -
 95
95 -
 96
96 -
 97
97 -
 98
98 -
 99
99 -
 100
100 -
 101
101 -
 102
102 -
 103
103 -
 104
104 -
 105
105 -
 106
106 -
 107
107 -
 108
108 -
 109
109 -
 110
110 -
 111
111 -
 112
112 -
113
-
114
-
115
-
116
-
117
-
118
-
119
-
120
-
121
-
122
-
123
-
124
-
125
-
126
-
127
-
128
 |
 |

100
Spirit of Australia
~Notes to the Financial Statements~
for the year ended 30 June 2005
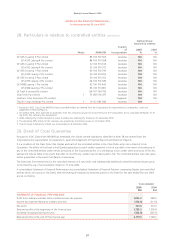
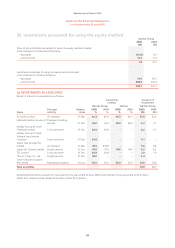
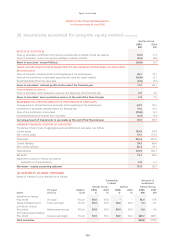
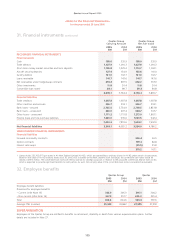
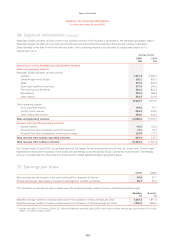
30. Investments accounted for using the equity method continued
Qantas Group
2005
$M
2004
$M
RESULTS OF ASSOCIATES
Share of associates’ profit/(loss) from ordinary activities before related income tax expense (5.2) 11.7
Share of associates’ income tax expense relating to ordinary activities (5.6) (3.6)
Share of associates’ net profit/(loss) (10.8) 8.1
SHARE OF POST-ACQUISITION RETAINED PROFITS AND RESERVES ATTRIBUTABLE TO ASSOCIATES
Retained profits
Share of associates’ retained profits at the beginning of the financial year 25.1 21.1
Share of net profit/(loss) of associates accounted for using the equity method (10.8) 8.1
Dividends/distributions from associates (2.6) (4.1)
Share of associates’ retained profits at the end of the financial year 11.7 25.1
Asset revaluation reserve
Share of associates’ asset revaluation reserve at the beginning of the financial year 2.9 2.9
Share of associates’ asset revaluation reserve at the end of the financial year 2.9 2.9
MOVEMENTS IN CARRYING AMOUNT OF INVESTMENTS IN ASSOCIATES
Carrying amount of investments in associates at the beginning of the financial year 69.7 55.5
Investments in associates acquired during the financial year 17.6 10.2
Share of net profit/(loss) of associates (10.8) 8.1
Dividends/distributions received from associates (2.6) (4.1)
Carrying amount of investments in associates at the end of the financial year 73.9 69.7
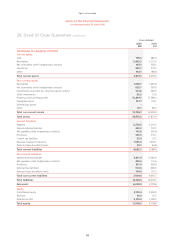
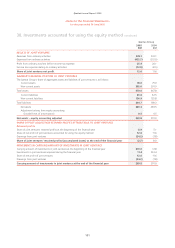
SUMMARY FINANCIAL POSITION OF ASSOCIATES
The Qantas Group’s share of aggregate assets and liabilities of associates is as follows:
Current assets 120.9 87.9
Non-current assets 91.7 115.3
Total assets 212.6 203.2
Current liabilities 79.1 66.6
Non-current liabilities 62.4 70.1
Total liabilities 141.5 136.7
Net assets 71.1 66.5
Adjustment arising from equity accounting:
Goodwill (net of amortisation) 2.8 3.2
Net assets – equity accounting adjusted 73.9 69.7
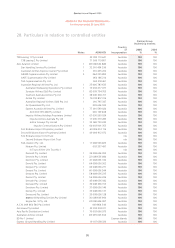
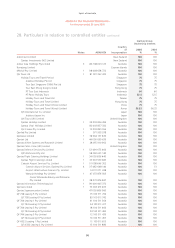
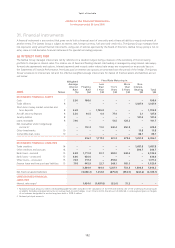
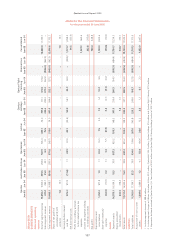
(b) INTERESTS IN JOINT VENTURES
Details of interests in joint ventures are as follows:
Ownership
Interest
Amount of
Investment
Qantas GroupQantasQantas Group
Name
Principal
Activity
Balance
Date
2005
%
2004
%
2005
%
2004
%
2005
$M
2004
$M
Australian air Express
Pty Limited Air cargo 30 Jun 50.0 50.0 ––18.5 17.8
Harvey Holidays Pty Ltd Tours and travel 30 Jun 50.0 50.0 50.0 50.0 1.6 0.7
Jet Turbine Services
Pty Limited Maintenance services 30 Jun 50.0 50.0 50.0 50.0 9.0 2.4
Star Track Express Holdings
Pty Limited Express road freight 30 Jun 50.0 50.0 50.0 50.0 240.7 249.1
Total associates 269.8 270.0