Qantas 2005 Annual Report Download - page 67
Download and view the complete annual report
Please find page 67 of the 2005 Qantas annual report below. You can navigate through the pages in the report by either clicking on the pages listed below, or by using the keyword search tool below to find specific information within the annual report.-
 1
1 -
2
-
3
-
4
-
5
-
6
-
7
-
8
-
9
-
10
-
11
-
12
-
13
-
14
-
15
-
16
-
17
-
18
-
19
-
20
-
21
-
22
-
23
-
24
-
25
-
26
-
27
-
28
-
29
-
30
-
31
-
32
-
33
-
34
-
35
-
36
-
37
-
38
-
39
-
40
-
41
-
42
-
43
-
44
-
45
-
46
-
47
-
48
-
49
-
50
-
51
-
52
-
53
-
54
-
55
-
56
-
 57
57 -
 58
58 -
 59
59 -
 60
60 -
 61
61 -
 62
62 -
 63
63 -
 64
64 -
 65
65 -
 66
66 -
 67
67 -
 68
68 -
 69
69 -
 70
70 -
 71
71 -
 72
72 -
 73
73 -
 74
74 -
 75
75 -
 76
76 -
 77
77 -
78
-
79
-
80
-
81
-
82
-
83
-
84
-
85
-
86
-
87
-
88
-
89
-
90
-
91
-
92
-
93
-
94
-
95
-
96
-
97
-
98
-
99
-
100
-
101
-
102
-
103
-
104
-
105
-
106
-
107
-
108
-
109
-
110
-
111
-
112
-
113
-
114
-
115
-
116
-
117
-
118
-
119
-
120
-
121
-
122
-
123
-
124
-
125
-
126
-
127
-
128
 |
 |

65
Qantas Annual Report 2005
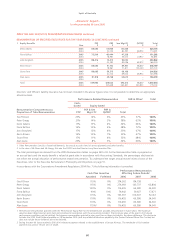
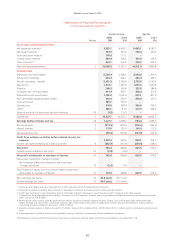
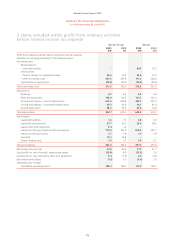
~Statements of Financial Performance~
for the year ended 30 June 2005
Qantas Group Qantas
Notes
2005
$M
2004
$M
2005
$M
2004
$M
SALES AND OPERATING REVENUE
Net passenger revenue1,2 9,835.1 8,978.3 8,605.1 8,182.7
Net freight revenue1,3 759.9 520.5 759.4 467.3
Tours and travel revenue 707.8 711.1 – –
Contract work revenue 484.9 502.6 367.0 276.5
Other sources3,4,5 861.1 641.2 780.5 943.3
Sales and operating revenue 2 12,648.8 11,353.7 10,512.0 9,869.8
EXPENDITURE
Manpower and staff related 3,244.9 2,938.5 2,649.8 2,501.9
Selling and marketing 444.3 466.1 423.4 434.7
Aircraft operating – variable 2,435.8 2,226.8 2,193.8 2,150.9
Fuel and oil 1,931.7 1,355.6 1,691.3 1,232.8
Property 300.5 309.8 257.8 284.8
Computer and communication 491.9 439.1 398.8 411.6
Depreciation and amortisation 1,100.0 1,005.6 961.1 871.0
Non-cancellable operating lease rentals 310.0 263.5 295.4 237.3
Tours and travel 563.7 570.9 ––
Capacity hire 341.0 287.4 346.6 255.5
Other6365.1 411.9 310.0 424.0
Share of net profit of associates and joint ventures 30 (1.8) (19.7) – –
Expenditure 3 11,527.1 10,255.5 9,528.0 8,804.5
Earnings before interest and tax 34 1,121.7 1,098.2 984.0 1,065.3
Borrowing costs 3 (211.5) (259.5) (216.3) (263.5)
Interest revenue 2 117.0 125.9 101.4 112.3
Net borrowing costs (94.5) (133.6) (114.9) (151.2)
Profit from ordinary activities before related income tax
expense 1,027.2 964.6 869.1 914.1
Income tax expense relating to ordinary activities 4 (262.8) (315.8) (239.6) (238.1)
Net profit 764.4 648.8 629.5 676.0
Outside equity interests in net profit 22 (0.8) (0.4) ––
Net profit attributable to members of Qantas 20 763.6 648.4 629.5 676.0
Non-owner transaction changes in equity:
Net exchange differences relating to self-sustaining
foreign operations 19 (2.6) 0.4 ––
Total changes in equity from non-owner related transactions
attributable to members of Qantas 21 761.0 648.8 629.5 676.0
Basic earnings per share 35 40.8 cents 35.7 cents
Diluted earnings per share 35 40.7 cents 35.5 cents
1 Passenger and freight revenue is disclosed net of both sales discount and interline/IATA commission.
2 Passenger recoveries (including fuel surcharge on passenger tickets) are disclosed as part of net passenger revenue.
3 Freight fuel surcharge is now disclosed as part of net freight revenue. Previously, it was disclosed as part of revenue from other sources.
Comparatives have been adjusted accordingly. The impact of this change for the prior year is to increase net freight revenue and decrease revenue from
other sources by $50.8 million.
4 Revenue from other sources includes revenue from aircraft charters and leases, property income, Qantas Club and Frequent Flyer membership fees,
freight terminal and service fees, commission revenue, age availed revenue and other miscellaneous income (including the release of surplus revenue
accounting provisions related to prior years of $52.1 million).
5 Excludes interest revenue of Qantas Group $117.0 million, Qantas $101.4 million (2004: $125.9 million, $112.3 million) which is included in net borrowing
costs.
6 Other expenditure includes contract work materials, printing, stationery, insurance and other miscellaneous expenses.
The Statements of Financial Performance are to be read in conjunction with the Notes to the Financial Statements on pages 68 to 118 .