NVIDIA 2012 Annual Report Download - page 92
Download and view the complete annual report
Please find page 92 of the 2012 NVIDIA annual report below. You can navigate through the pages in the report by either clicking on the pages listed below, or by using the keyword search tool below to find specific information within the annual report.-
 1
1 -
2
-
3
-
4
-
5
-
6
-
7
-
8
-
9
-
10
-
11
-
12
-
13
-
14
-
15
-
16
-
17
-
18
-
19
-
20
-
21
-
22
-
23
-
24
-
25
-
26
-
27
-
28
-
29
-
30
-
31
-
32
-
33
-
34
-
35
-
36
-
37
-
38
-
39
-
40
-
41
-
42
-
43
-
44
-
45
-
46
-
47
-
48
-
49
-
50
-
51
-
52
-
53
-
54
-
55
-
56
-
57
-
58
-
59
-
60
-
61
-
62
-
63
-
64
-
65
-
66
-
67
-
68
-
69
-
70
-
71
-
72
-
73
-
74
-
75
-
76
-
77
-
78
-
79
-
80
-
81
-
 82
82 -
 83
83 -
 84
84 -
 85
85 -
 86
86 -
 87
87 -
 88
88 -
 89
89 -
 90
90 -
 91
91 -
 92
92 -
 93
93 -
 94
94 -
 95
95 -
 96
96 -
 97
97 -
 98
98 -
 99
99 -
 100
100 -
 101
101 -
 102
102 -
103
-
104
-
105
-
106
-
107
-
108
-
109
-
110
-
111
-
112
-
113
-
114
-
115
-
116
-
117
-
118
-
119
-
120
 |
 |

Table of Contents NVIDIA CORPORATION AND SUBSIDIARIES
NOTES TO THE CONSOLIDATED FINANCIAL STATEMENTS
(Continued)
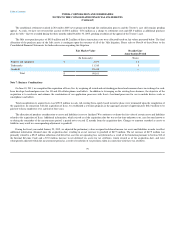
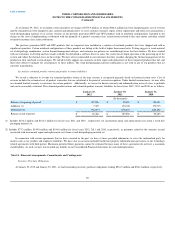
As of January 29, 2012, we recorded a total cumulative net charge of $475.9 million, of which $466.4 million has been charged against cost of revenue
and the remainder has been charged to sales, general and administrative to cover customer warranty, repair, return, replacement and other costs arising from a
weak die/packaging material set in certain versions of our previous generation MCP and GPU products used in notebook configurations. Included in the
charge are the costs of implementing a settlement with the plaintiffs of a putative consumer class action lawsuit related to this same matter and other related
estimated consumer class action settlements.
The previous generation MCP and GPU products that are impacted were included in a number of notebook products that were shipped and sold in
significant quantities. Certain notebook configurations of these products are failing in the field at higher than normal rates. Testing suggests a weak material
set of die/package combination, system thermal management designs, and customer use patterns are contributing factors for these failures. We have worked
with our customers to develop and have made available for download a software driver to cause the system fan to begin operation at the powering up of the
system and reduce the thermal stress on these chips. We have also recommended to our customers that they consider changing the thermal management of the
products in their notebook system designs. We intend to fully support our customers in their repair and replacement of these impacted products that fail, and
their other efforts to mitigate the consequences of these failures. The weak die/packaging material combination is not used in any of our products that are
currently in production.
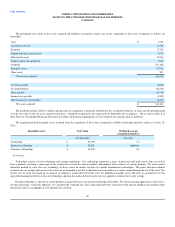
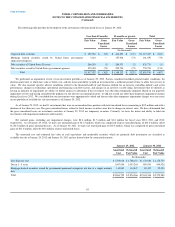
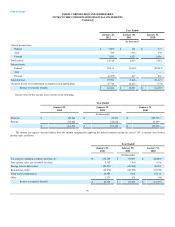
Accrual for estimated product returns and product warranty liabilities
We record a reduction to revenue for estimated product returns at the time revenue is recognized primarily based on historical return rates. Cost of
revenue includes the estimated cost of product warranties that are calculated at the point of revenue recognition. Under limited circumstances, we may offer
an extended limited warranty to customers for certain products. Additionally, we accrue for known warranty and indemnification issues if a loss is probable
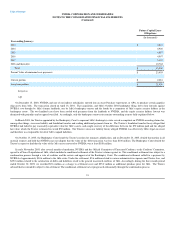
and can be reasonably estimated. The estimated product returns and estimated product warranty liabilities for fiscal years 2012 , 2011 and 2010 are as follows:
January 29,
2012 January 30,
2011 January 31,
2010
(In thousands)
Balance at beginning of period $ 107,896 $ 92,655 $ 150,631
Additions (1) 7,329 194,108 170,715
Deductions (2) (96,819) (178,867) (228,691)
Balance at end of period $ 18,406 $ 107,896 $ 92,655
(1) Includes $186.2 million and $164.5 million for fiscal years 2011 and 2010 , respectively, for incremental repair and replacement costs from a weak die/
packaging material set.
(2) Includes $73.3 million, $149.8 million and $196.0 million for fiscal years 2012, 2011 and 2010, respectively, in payments related to the warranty accrual
associated with incremental repair and replacement costs from a weak die/packaging material set.
In connection with certain agreements that we have executed in the past, we have at times provided indemnities to cover the indemnified party for
matters such as tax, product and employee liabilities. We have also on occasion included intellectual property indemnification provisions in our technology
related agreements with third parties. Maximum potential future payments cannot be estimated because many of these agreements do not have a maximum
stated liability. As such, we have not recorded any liability in our Consolidated Financial Statements for such indemnifications.
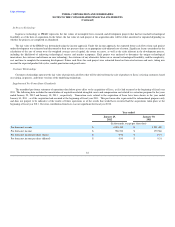
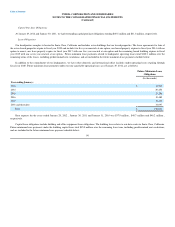
Note 14 - Financial Arrangements, Commitments and Contingencies
Inventory Purchase Obligations
At January 29, 2012 and January 30, 2011, we had outstanding inventory purchase obligations totaling $561.3 million and $546.4 million, respectively.
89