NVIDIA 2012 Annual Report Download - page 56
Download and view the complete annual report
Please find page 56 of the 2012 NVIDIA annual report below. You can navigate through the pages in the report by either clicking on the pages listed below, or by using the keyword search tool below to find specific information within the annual report.-
 1
1 -
2
-
3
-
4
-
5
-
6
-
7
-
8
-
9
-
10
-
11
-
12
-
13
-
14
-
15
-
16
-
17
-
18
-
19
-
20
-
21
-
22
-
23
-
24
-
25
-
26
-
27
-
28
-
29
-
30
-
31
-
32
-
33
-
34
-
35
-
36
-
37
-
38
-
39
-
40
-
41
-
42
-
43
-
44
-
45
-
 46
46 -
 47
47 -
 48
48 -
 49
49 -
 50
50 -
 51
51 -
 52
52 -
 53
53 -
 54
54 -
 55
55 -
 56
56 -
 57
57 -
 58
58 -
 59
59 -
 60
60 -
 61
61 -
 62
62 -
 63
63 -
 64
64 -
 65
65 -
 66
66 -
67
-
68
-
69
-
70
-
71
-
72
-
73
-
74
-
75
-
76
-
77
-
78
-
79
-
80
-
81
-
82
-
83
-
84
-
85
-
86
-
87
-
88
-
89
-
90
-
91
-
92
-
93
-
94
-
95
-
96
-
97
-
98
-
99
-
100
-
101
-
102
-
103
-
104
-
105
-
106
-
107
-
108
-
109
-
110
-
111
-
112
-
113
-
114
-
115
-
116
-
117
-
118
-
119
-
120
 |
 |

Table of Contents
Off-Balance Sheet Arrangements
As of January 29, 2012, we had no material off-balance sheet arrangements as defined in Regulation S-K 303(a)(4)(ii).
Adoption of New and Recently Issued Accounting Pronouncements
Please see Note 1 of the Notes to the Consolidated Financial Statements in Part IV, Item 15 of this Form 10-K for a discussion of adoption of new and
recently issued accounting pronouncements.
ITEM 7A. QUANTITATIVE AND QUALITATIVE DISCLOSURES ABOUT MARKET RISK
Investment and Interest Rate Risk
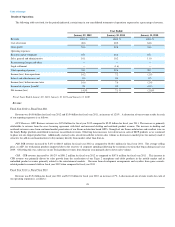
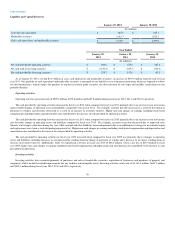
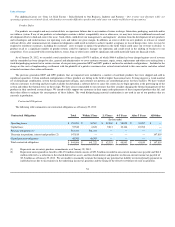
As of January 29, 2012 and January 30, 2011 , we had $3.13 billion and $2.49 billion , respectively, in cash, cash equivalents and marketable
securities. We invest in a variety of financial instruments, consisting principally of cash and cash equivalents, asset-backed securities, commercial paper,
mortgage-backed securities issued by Government-sponsored enterprises, money market funds and debt securities of corporations, municipalities and the
United States government and its agencies. As of January 29, 2012 , we did not have any investments in auction-rate preferred securities. Our investments are
denominated in United States dollars.
All of the cash equivalents and marketable securities are treated as “available-for-sale.” Investments in both fixed rate and floating rate interest earning
instruments carry a degree of interest rate risk. Fixed rate securities may have their market value adversely impacted due to a rise in interest rates, while
floating rate securities may produce less income than expected if interest rates fall. Due in part to these factors, our future investment income may fall short of
expectations due to changes in interest rates or if the decline in fair value of our publicly traded debt or equity investments is judged to be other-than-
temporary. We may suffer losses in principal if we are forced to sell securities that decline in securities market value due to changes in interest rates.
However, because any debt securities we hold are classified as “available-for-sale,” no gains or losses are realized in our Consolidated Statements of
Operations due to changes in interest rates unless such securities are sold prior to maturity or unless declines in value are determined to be other-than-
temporary. These securities are reported at fair value with the related unrealized gains and losses included in accumulated other comprehensive income (loss),
a component of stockholders’ equity, net of tax.
As of January 29, 2012 , we performed a sensitivity analysis on our floating and fixed rate financial investments. According to our analysis, parallel
shifts in the yield curve of both plus or minus 0.5% would result in changes in fair values for these investments of approximately $13.7 million .
The financial turmoil that affected the banking system and financial markets and increased the possibility that financial institutions might consolidate or
go out of business resulted in a tightening in the credit markets, a low level of liquidity in many financial markets, and extreme volatility in fixed income,
credit, currency and equity markets. There could be a number of follow-on effects from the credit crisis on our business, including insolvency of key suppliers
resulting in product delays; inability of customers, including channel partners, to obtain credit to finance purchases of our products and/or customer, including
channel partner, insolvencies; and failure of financial institutions, which may negatively impact our treasury operations. Other income and expense could also
vary materially from expectations depending on gains or losses realized on the sale or exchange of financial instruments; impairment charges related to debt
securities as well as equity and other investments; interest rates; and cash, cash equivalent and marketable securities balances. Volatility in the financial
markets and economic uncertainty increases the risk that the actual amounts realized in the future on our financial instruments could differ significantly from
the fair values currently assigned to them. As of January 29, 2012 , our investments in government agencies and government sponsored enterprises
represented approximately 51% of our total investment portfolio, while the financial sector accounted for approximately 24% of our total investment
portfolio. Of the financial sector investments, over half are guaranteed by the U.S. government. Substantially all of our investments are with A/A2 or better
rated securities. If the fair value of our investments in these sectors was to decline by 2%-5%, the fair values of these investments would decline by
approximately $43 -$107 million .
Exchange Rate Risk
We consider our direct exposure to foreign exchange rate fluctuations to be minimal. Gains or losses from foreign currency remeasurement are included
in “Other income (expense), net” in our Consolidated Financial Statements and to date have not been significant. The impact of foreign currency transaction
gain (loss) included in determining net income (loss) for fiscal years 2012, 2011 and 2010 was $1.6 million, $(2.4) million and $(0.9) million,
respectively. Currently, sales and arrangements with third-party manufacturers provide for pricing and payment in United States dollars, and, therefore, are
not subject to exchange rate fluctuations. Increases in the value of the United States’ dollar relative to other currencies would make our products more
expensive,
55