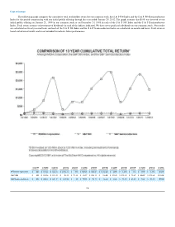
NVIDIA 2012 Annual Report Download - page 46
Download and view the complete annual report
Please find page 46 of the 2012 NVIDIA annual report below. You can navigate through the pages in the report by either clicking on the pages listed below, or by using the keyword search tool below to find specific information within the annual report.-
 1
1 -
2
-
3
-
4
-
5
-
6
-
7
-
8
-
9
-
10
-
11
-
12
-
13
-
14
-
15
-
16
-
17
-
18
-
19
-
20
-
21
-
22
-
23
-
24
-
25
-
26
-
27
-
28
-
29
-
30
-
31
-
32
-
33
-
34
-
35
-
 36
36 -
 37
37 -
 38
38 -
 39
39 -
 40
40 -
 41
41 -
 42
42 -
 43
43 -
 44
44 -
 45
45 -
 46
46 -
 47
47 -
 48
48 -
 49
49 -
 50
50 -
 51
51 -
 52
52 -
 53
53 -
 54
54 -
 55
55 -
 56
56 -
57
-
58
-
59
-
60
-
61
-
62
-
63
-
64
-
65
-
66
-
67
-
68
-
69
-
70
-
71
-
72
-
73
-
74
-
75
-
76
-
77
-
78
-
79
-
80
-
81
-
82
-
83
-
84
-
85
-
86
-
87
-
88
-
89
-
90
-
91
-
92
-
93
-
94
-
95
-
96
-
97
-
98
-
99
-
100
-
101
-
102
-
103
-
104
-
105
-
106
-
107
-
108
-
109
-
110
-
111
-
112
-
113
-
114
-
115
-
116
-
117
-
118
-
119
-
120
 |
 |

Table of Contents
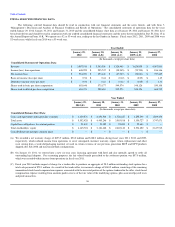
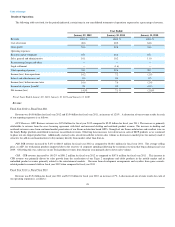
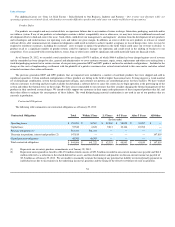
Results of Operations
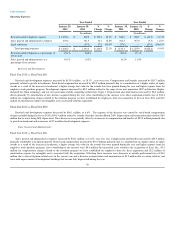
The following table sets forth, for the periods indicated, certain items in our consolidated statements of operations expressed as a percentage of revenue.
Year Ended
January 29, 2012 January 30, 2011 January 31, 2010
Revenue 100.0% 100.0 % 100.0 %
Cost of revenue 48.6 60.2 64.6
Gross profit 51.4 39.8 35.4
Operating expenses:
Research and development 25.1 24.0 27.3
Sales, general and administrative 10.1 10.2 11.0
Restructuring charges and other — — —
Legal settlement — (1.6) —
Total operating expenses 35.2 32.6 38.3
Income (loss) from operations 16.2 7.2 (2.9)
Interest and other income, net 0.4 0.4 0.5
Income (loss) before income taxes 16.6 7.6 (2.4)
Income tax expense (benefit) 2.1 0.5 (0.4)
Net income (loss) 14.5% 7.1 % (2.0)%
Fiscal Years Ended January 29, 2012, January 30, 2011,and January 31, 2010
Revenue
Fiscal Year 2012 vs. Fiscal Year 2011
Revenue was $4.00 billion for fiscal year 2012 and $3.54 billion for fiscal year 2011, an increase of 12.8%. A discussion of our revenue results for each
of our reporting segments is as follows:
GPU Business. GPU Business revenue was $2.54 billion for fiscal year 2012 compared to $2.52 billion for fiscal year 2011. The increase is primarily
attributable to revenue from the cross licensing agreement with Intel and increased desktop and notebook product revenue. The increase in desktop and
notebook revenues came from continued market penetration of our Fermi architecture based GPUs. Strength of our Fermi architecture and resultant wins on
the Sandy Bridge platform contributed to increase in notebook revenues. Offsetting these increases were decreases in sales of MCP products as we continued
to phase out our chipset product line. Additionally, memory sales also decreased due to lower sales volume as decreases in market price for memory made it
attractive for add-in card manufacturers to buy memory directly from market rather than from us.
PSB. PSB revenue increased by 5.6% to $864.3 million for fiscal year 2012 as compared to $818.6 million for fiscal year 2011. The average selling
price, or ASP, for workstation products improved due to the recovery of corporate spending following the economic recession that began during fiscal year
2009. Offsetting this was a decrease in our Tesla product revenues from the prior year primarily due to lower sales volume.
CPB. CPB revenue increased by 199.2% to $591.2 million for fiscal year 2012 as compared to $197.6 million for fiscal year 2011 . This increase in
CPB revenue was primarily driven by sales growth from the acceleration of our Tegra 2 smartphone and tablet products in the mobile market and in
embedded product revenues primarily related to the entertainment markets. Revenue from development arrangements and royalties from game console-
related products remained stable in fiscal year 2012 when compared to fiscal year 2011 .
Fiscal Year 2011 vs. Fiscal Year 2010
Revenue was $3.54 billion for fiscal year 2011 and $3.33 billion for fiscal year 2010, an increase of 7%. A discussion of our revenue results for each of
our operating segments is as follows:
45