NVIDIA 2012 Annual Report Download - page 86
Download and view the complete annual report
Please find page 86 of the 2012 NVIDIA annual report below. You can navigate through the pages in the report by either clicking on the pages listed below, or by using the keyword search tool below to find specific information within the annual report.-
 1
1 -
2
-
3
-
4
-
5
-
6
-
7
-
8
-
9
-
10
-
11
-
12
-
13
-
14
-
15
-
16
-
17
-
18
-
19
-
20
-
21
-
22
-
23
-
24
-
25
-
26
-
27
-
28
-
29
-
30
-
31
-
32
-
33
-
34
-
35
-
36
-
37
-
38
-
39
-
40
-
41
-
42
-
43
-
44
-
45
-
46
-
47
-
48
-
49
-
50
-
51
-
52
-
53
-
54
-
55
-
56
-
57
-
58
-
59
-
60
-
61
-
62
-
63
-
64
-
65
-
66
-
67
-
68
-
69
-
70
-
71
-
72
-
73
-
74
-
75
-
 76
76 -
 77
77 -
 78
78 -
 79
79 -
 80
80 -
 81
81 -
 82
82 -
 83
83 -
 84
84 -
 85
85 -
 86
86 -
 87
87 -
 88
88 -
 89
89 -
 90
90 -
 91
91 -
 92
92 -
 93
93 -
 94
94 -
 95
95 -
 96
96 -
97
-
98
-
99
-
100
-
101
-
102
-
103
-
104
-
105
-
106
-
107
-
108
-
109
-
110
-
111
-
112
-
113
-
114
-
115
-
116
-
117
-
118
-
119
-
120
 |
 |
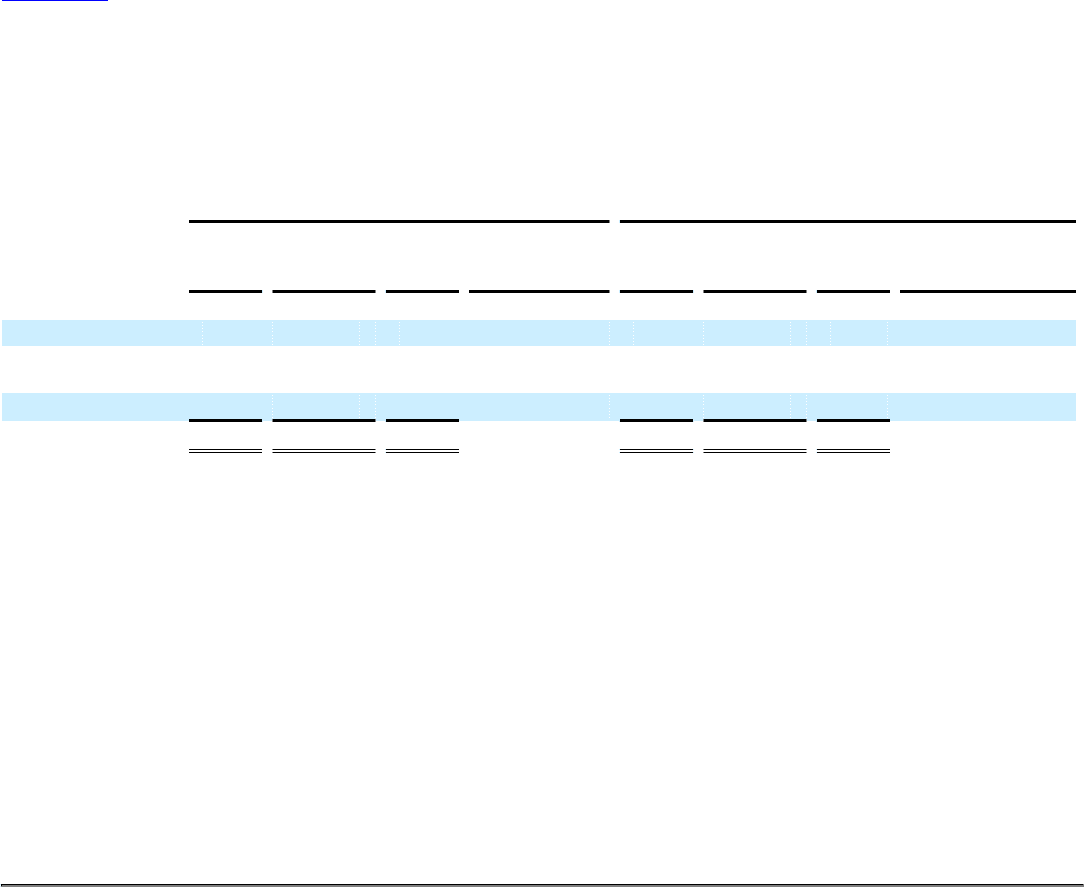
Table of Contents NVIDIA CORPORATION AND SUBSIDIARIES
NOTES TO THE CONSOLIDATED FINANCIAL STATEMENTS
(Continued)
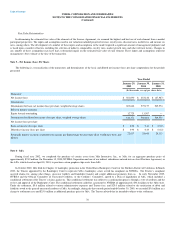
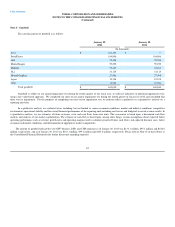
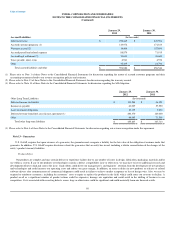
Note 9 - Amortizable Intangible Assets
The components of our amortizable intangible assets are as follows:
January 29, 2012 January 30, 2011
Gross
Carrying
Amount
Accumulated
Amortization Net
Carrying
Amount
Weighted Average
Useful Life Gross
Carrying
Amount
Accumulated
Amortization Net
Carrying
Amount
Weighted Average
Useful Life
(In thousands) (In years) (In thousands) (In years)
Technology licenses $ 319,930 $ (99,302) $ 220,628 7.6 $ 320,477 $ (62,791) $ 257,686 7.6
Acquired intellectual
property 172,039 (79,261) 92,778 6.0 75,339 (61,114) 14,225 3.8
Patents 32,456 (19,726) 12,730 5.3 32,203 (15,369) 16,834 5.3
Total intangible assets $ 524,425 $ (198,289) $ 326,136 $ 428,019 $ (139,274) $ 288,745
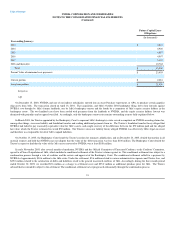
Amortization expense associated with intangible assets for fiscal years 2012, 2011 and 2010 was $59.0 million, $30.0 million and $31.9
million, respectively. Future amortization expense for the net carrying amount of intangible assets at January 29, 2012 is estimated to be $56.2 million in
fiscal year 2013, $51.3 million in fiscal year 2014, $51.3 million in fiscal year 2015, $46.0 million in fiscal year 2016, $33.1 million in fiscal year 2017 and
$88.2 million in fiscal years subsequent to fiscal year 2017 until fully amortized.
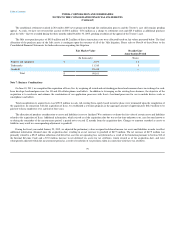
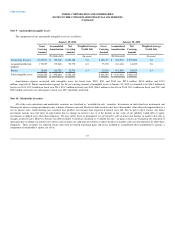
Note 10 - Marketable Securities
All of the cash equivalents and marketable securities are classified as “available-for-sale” securities. Investments in both fixed rate instruments and
floating rate interest earning instruments carry a degree of interest rate risk. Fixed rate debt securities may have their market value adversely impacted due to a
rise in interest rates, while floating rate securities may produce less income than expected if interest rates fall. Due in part to these factors, our future
investment income may fall short of expectations due to changes in interest rates or if the decline in fair value of our publicly traded debt or equity
investments is judged to be other-than-temporary. We may suffer losses in principal if we are forced to sell securities that decline in market value due to
changes in interest rates. However, because any debt securities we hold are classified as “available-for-sale,” no gains or losses are realized in our statement of
operations due to changes in interest rates unless such securities are sold prior to maturity or unless declines in market values are determined to be other-than-
temporary. These securities are reported at fair value with the related unrealized gains and losses included in accumulated other comprehensive income, a
component of stockholders’ equity, net of tax.
83