NVIDIA 2012 Annual Report Download - page 90
Download and view the complete annual report
Please find page 90 of the 2012 NVIDIA annual report below. You can navigate through the pages in the report by either clicking on the pages listed below, or by using the keyword search tool below to find specific information within the annual report.-
 1
1 -
2
-
3
-
4
-
5
-
6
-
7
-
8
-
9
-
10
-
11
-
12
-
13
-
14
-
15
-
16
-
17
-
18
-
19
-
20
-
21
-
22
-
23
-
24
-
25
-
26
-
27
-
28
-
29
-
30
-
31
-
32
-
33
-
34
-
35
-
36
-
37
-
38
-
39
-
40
-
41
-
42
-
43
-
44
-
45
-
46
-
47
-
48
-
49
-
50
-
51
-
52
-
53
-
54
-
55
-
56
-
57
-
58
-
59
-
60
-
61
-
62
-
63
-
64
-
65
-
66
-
67
-
68
-
69
-
70
-
71
-
72
-
73
-
74
-
75
-
76
-
77
-
78
-
79
-
 80
80 -
 81
81 -
 82
82 -
 83
83 -
 84
84 -
 85
85 -
 86
86 -
 87
87 -
 88
88 -
 89
89 -
 90
90 -
 91
91 -
 92
92 -
 93
93 -
 94
94 -
 95
95 -
 96
96 -
 97
97 -
 98
98 -
 99
99 -
 100
100 -
101
-
102
-
103
-
104
-
105
-
106
-
107
-
108
-
109
-
110
-
111
-
112
-
113
-
114
-
115
-
116
-
117
-
118
-
119
-
120
 |
 |
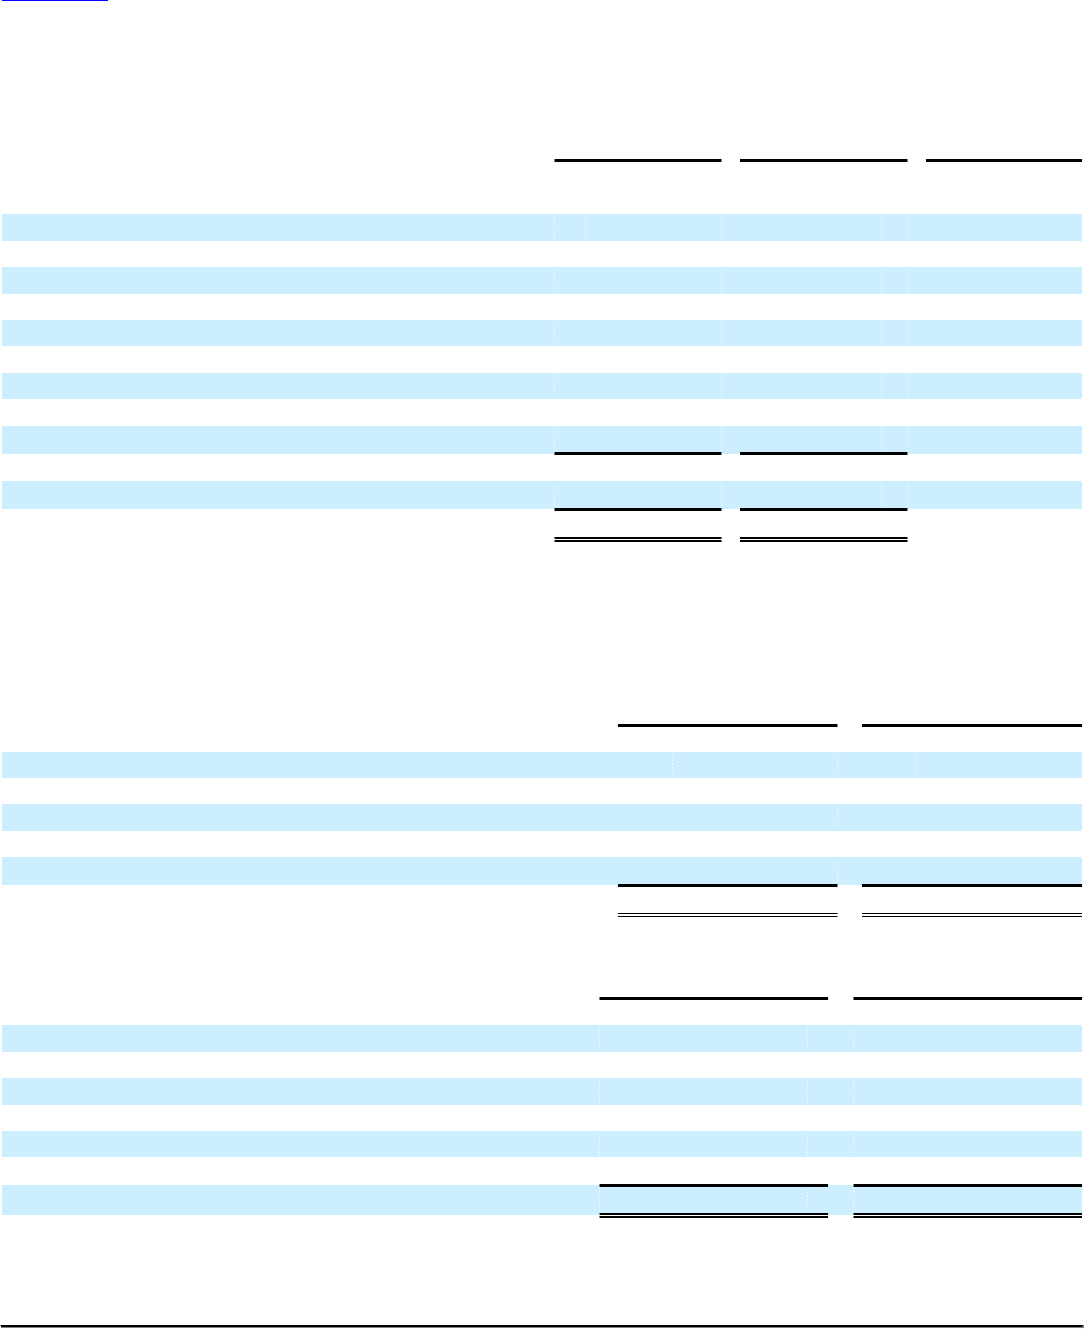
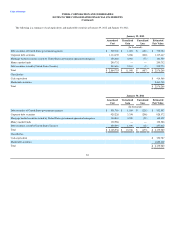
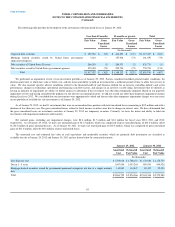
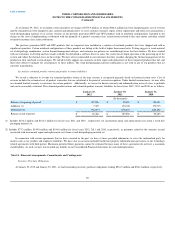
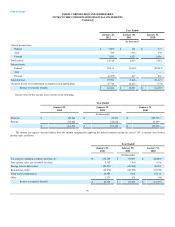
Table of Contents NVIDIA CORPORATION AND SUBSIDIARIES
NOTES TO THE CONSOLIDATED FINANCIAL STATEMENTS
(Continued)
January 29,
2012 January 30,
2011 Estimated
Useful Life
(In thousands) (Years)
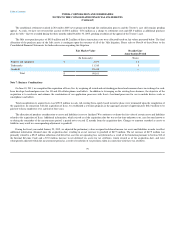
Property and Equipment:
Land $ 218,496 $ 217,372 (A)
Building 30,869 29,326 3-25
Test equipment 299,506 293,807 3-5
Software and licenses 211,339 306,699 3-5
Leasehold improvements 143,986 146,508 (B)
Computer equipment 168,455 132,896 3
Office furniture and equipment 45,521 36,239 5
Capital leases 27,264 26,618 (B)
Construction in process 11,092 4,474 (C)
Total property and equipment, gross 1,156,528 1,193,939
Accumulated depreciation and amortization (596,456) (625,082)
Total property and equipment, net $ 560,072 $ 568,857
(A) Land is a non-depreciable asset.
(B) Leasehold improvements and capital leases are amortized based on the lesser of either the asset’s estimated useful life or the remaining lease term.
(C) Construction in process represents assets that are not in service as of the balance sheet date.
Depreciation expense for fiscal years 2012, 2011 and 2010 was $145.2 million, $157 million and $164.8 million, respectively.
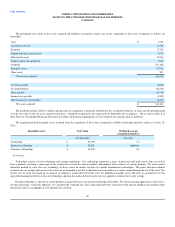
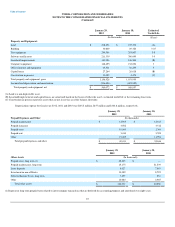
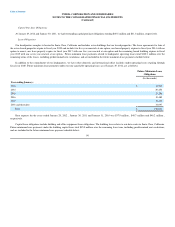
January 29,
2012 January 30,
2011
Prepaid Expenses and Other (In thousands)
Prepaid maintenance $ 12,965 $ 12,165
Prepaid insurance 3,502 3,512
Prepaid taxes 10,069 1,364
Prepaid rent 3,410 3,599
Other 19,465 11,996
Total prepaid expenses and other $ 49,411 $ 32,636
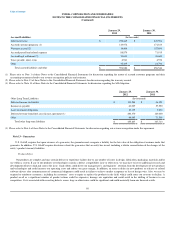
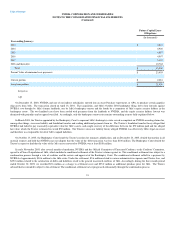
January 29,
2012 January 30,
2011
Other Assets (In thousands)
Prepaid taxes, long term (1) $ 68,805 $ —
Prepaid maintenance, long term 15,175 21,239
Lease deposits 8,027 7,003
Investment in non-affiliates 10,382 8,792
Deferred Income Taxes, long term 7,459 851
Other 10,484 2,965
Total other assets $ 120,332 $ 40,850
(1) Represents long-term prepaid taxes related to inter-company transactions that are deferred for accounting purposes and amortized over eight years.
87