NVIDIA 2012 Annual Report Download - page 35
Download and view the complete annual report
Please find page 35 of the 2012 NVIDIA annual report below. You can navigate through the pages in the report by either clicking on the pages listed below, or by using the keyword search tool below to find specific information within the annual report.-
 1
1 -
2
-
3
-
4
-
5
-
6
-
7
-
8
-
9
-
10
-
11
-
12
-
13
-
14
-
15
-
16
-
17
-
18
-
19
-
20
-
21
-
22
-
23
-
24
-
 25
25 -
 26
26 -
 27
27 -
 28
28 -
 29
29 -
 30
30 -
 31
31 -
 32
32 -
 33
33 -
 34
34 -
 35
35 -
 36
36 -
 37
37 -
 38
38 -
 39
39 -
 40
40 -
 41
41 -
 42
42 -
 43
43 -
 44
44 -
 45
45 -
46
-
47
-
48
-
49
-
50
-
51
-
52
-
53
-
54
-
55
-
56
-
57
-
58
-
59
-
60
-
61
-
62
-
63
-
64
-
65
-
66
-
67
-
68
-
69
-
70
-
71
-
72
-
73
-
74
-
75
-
76
-
77
-
78
-
79
-
80
-
81
-
82
-
83
-
84
-
85
-
86
-
87
-
88
-
89
-
90
-
91
-
92
-
93
-
94
-
95
-
96
-
97
-
98
-
99
-
100
-
101
-
102
-
103
-
104
-
105
-
106
-
107
-
108
-
109
-
110
-
111
-
112
-
113
-
114
-
115
-
116
-
117
-
118
-
119
-
120
 |
 |
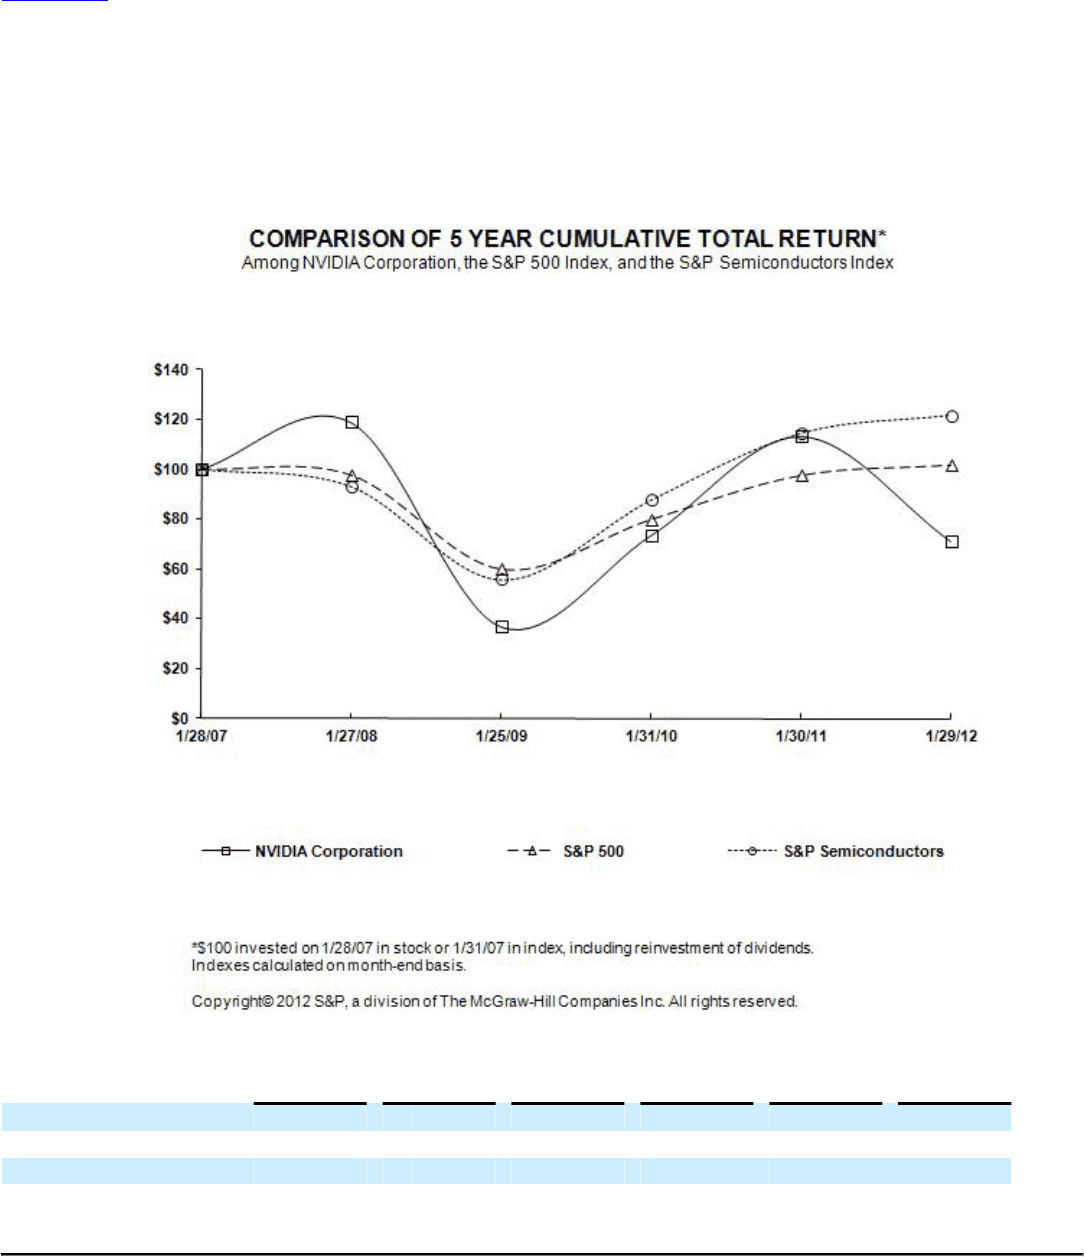
Table of Contents
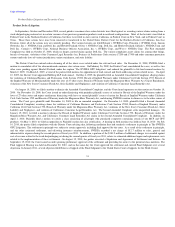
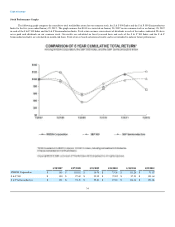
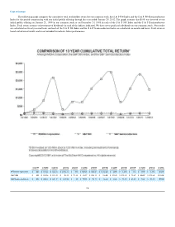
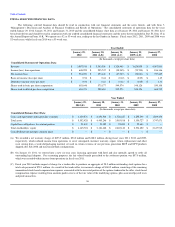
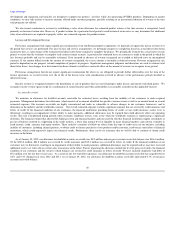
Stock Performance Graphs
The following graph compares the cumulative total stockholder return for our common stock, the S & P 500 Index and the S & P 500 Semiconductors
Index for the five years ended January 29, 2012 . The graph assumes that $100 was invested on January 28, 2007 in our common stock or on January 28, 2007
in each of the S & P 500 Index and the S & P Semiconductors Index. Total return assumes reinvestment of dividends in each of the indices indicated. We have
never paid cash dividends on our common stock. Our results are calculated on fiscal year-end basis and each of the S & P 500 Index and the S & P
Semiconductors Index are calculated on month-end basis. Total return is based on historical results and is not intended to indicate future performance.
1/28/2007 1/27/2008 1/25/2009 1/31/2010 1/30/2011 1/29/2012
NVIDIA Corporation $ 100 $ 118.92 $ 36.75 $ 73.36 $ 113.25 $ 71.07
S & P 500 $ 100 $ 97.69 $ 59.95 $ 79.82 $ 97.53 $ 101.64
S & P Semiconductors $ 100 $ 93.19 $ 55.86 $ 87.69 $ 114.44 $ 121.68
34