NVIDIA 2012 Annual Report Download - page 89
Download and view the complete annual report
Please find page 89 of the 2012 NVIDIA annual report below. You can navigate through the pages in the report by either clicking on the pages listed below, or by using the keyword search tool below to find specific information within the annual report.-
 1
1 -
2
-
3
-
4
-
5
-
6
-
7
-
8
-
9
-
10
-
11
-
12
-
13
-
14
-
15
-
16
-
17
-
18
-
19
-
20
-
21
-
22
-
23
-
24
-
25
-
26
-
27
-
28
-
29
-
30
-
31
-
32
-
33
-
34
-
35
-
36
-
37
-
38
-
39
-
40
-
41
-
42
-
43
-
44
-
45
-
46
-
47
-
48
-
49
-
50
-
51
-
52
-
53
-
54
-
55
-
56
-
57
-
58
-
59
-
60
-
61
-
62
-
63
-
64
-
65
-
66
-
67
-
68
-
69
-
70
-
71
-
72
-
73
-
74
-
75
-
76
-
77
-
78
-
 79
79 -
 80
80 -
 81
81 -
 82
82 -
 83
83 -
 84
84 -
 85
85 -
 86
86 -
 87
87 -
 88
88 -
 89
89 -
 90
90 -
 91
91 -
 92
92 -
 93
93 -
 94
94 -
 95
95 -
 96
96 -
 97
97 -
 98
98 -
 99
99 -
100
-
101
-
102
-
103
-
104
-
105
-
106
-
107
-
108
-
109
-
110
-
111
-
112
-
113
-
114
-
115
-
116
-
117
-
118
-
119
-
120
 |
 |

Table of Contents NVIDIA CORPORATION AND SUBSIDIARIES
NOTES TO THE CONSOLIDATED FINANCIAL STATEMENTS
(Continued)
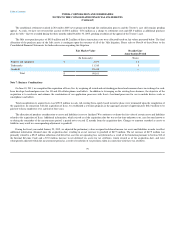
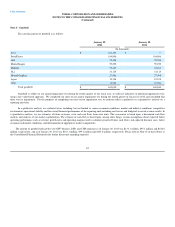
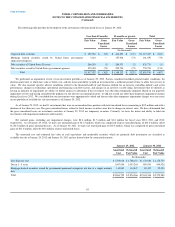
Note 11 – Fair Value of Cash Equivalents and Marketable Securities
We measure our cash equivalents and marketable securities at fair value. The fair values of our financial assets and liabilities are determined using
quoted market prices of identical assets or quoted market prices of similar assets from active markets. Our Level 1 assets consist of our money market
funds. We classify securities within Level 1 assets when the fair value is obtained from real time quotes for transactions in active exchange markets involving
identical assets. Our available-for- sale securities are classified as having Level 2 inputs. Our Level 2 assets are valued utilizing a market approach where the
market prices of similar assets are provided by a variety of independent industry standard data providers to our investment custodian. There were no
significant transfers between Levels 1 and 2 assets for the year ended January 29, 2012. Level 3 assets are based on unobservable inputs to the valuation
methodology and include our own data about assumptions market participants would use in pricing the asset or liability based on the best information
available under the circumstances.
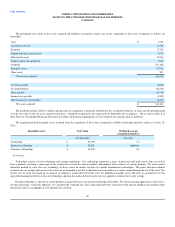
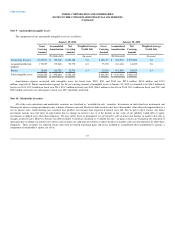
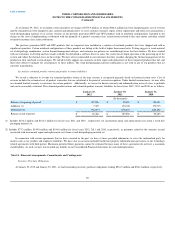
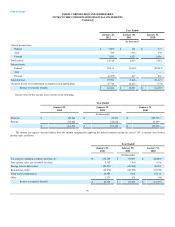
Financial assets and liabilities measured at fair value are summarized below:
Fair value measurement at reporting date using
Quoted Prices in Active Markets for Identical
Assets Significant Other Observable Inputs
January 29, 2012 (Level 1) (Level 2)
(In thousands)
Debt securities of United
States government agencies (1) $ 770,754 $ — $ 770,754
Corporate debt securities (2) 1,117,447 — 1,117,447
Mortgage backed securities issued by
United States government-sponsored
enterprises (3)
161,559 — 161,559
Money market funds (4) 290,732 290,732 —
Debt securities issued by United
States Treasury (5) 535,774 — 535,774
Total assets $ 2,876,266 $ 290,732 $ 2,585,534
(1) Includes $23.0 million in Cash Equivalents and $747.8 million in Marketable Securities on the Consolidated Balance Sheet.
(2) Includes $ 64.9 million in Cash Equivalents and $ 1,052.5 million in Marketable Securities on the Consolidated Balance Sheet.
(3) Included in Marketable Securities on the Consolidated Balance Sheet.
(4) Included in Cash Equivalents on the Consolidated Balance Sheet.
(5) Includes $36.0 million in Cash Equivalents and $499.8 million in Marketable Securities on the Consolidated Balance Sheet.
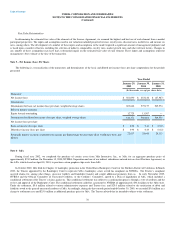
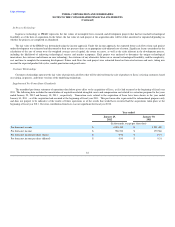
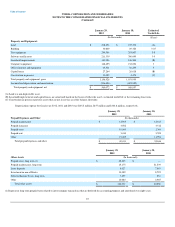
Note 12 - Balance Sheet Components
Certain balance sheet components are as follows:
January 29,
2012 January 30,
2011
Inventories: (In thousands)
Raw materials $ 84,927 $ 67,880
Work in-process 62,934 72,698
Finished goods 192,436 204,947
Total inventories $ 340,297 $ 345,525
86