NVIDIA 2012 Annual Report Download - page 105
Download and view the complete annual report
Please find page 105 of the 2012 NVIDIA annual report below. You can navigate through the pages in the report by either clicking on the pages listed below, or by using the keyword search tool below to find specific information within the annual report.-
 1
1 -
2
-
3
-
4
-
5
-
6
-
7
-
8
-
9
-
10
-
11
-
12
-
13
-
14
-
15
-
16
-
17
-
18
-
19
-
20
-
21
-
22
-
23
-
24
-
25
-
26
-
27
-
28
-
29
-
30
-
31
-
32
-
33
-
34
-
35
-
36
-
37
-
38
-
39
-
40
-
41
-
42
-
43
-
44
-
45
-
46
-
47
-
48
-
49
-
50
-
51
-
52
-
53
-
54
-
55
-
56
-
57
-
58
-
59
-
60
-
61
-
62
-
63
-
64
-
65
-
66
-
67
-
68
-
69
-
70
-
71
-
72
-
73
-
74
-
75
-
76
-
77
-
78
-
79
-
80
-
81
-
82
-
83
-
84
-
85
-
86
-
87
-
88
-
89
-
90
-
91
-
92
-
93
-
94
-
 95
95 -
 96
96 -
 97
97 -
 98
98 -
 99
99 -
 100
100 -
 101
101 -
 102
102 -
 103
103 -
 104
104 -
 105
105 -
 106
106 -
 107
107 -
 108
108 -
 109
109 -
 110
110 -
 111
111 -
 112
112 -
 113
113 -
 114
114 -
 115
115 -
116
-
117
-
118
-
119
-
120
 |
 |

Table of Contents NVIDIA CORPORATION AND SUBSIDIARIES
NOTES TO THE CONSOLIDATED FINANCIAL STATEMENTS
(Continued)
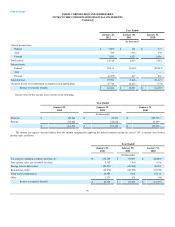
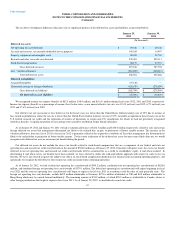
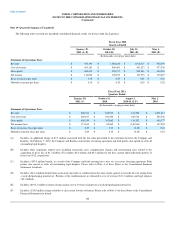
Note 19- Quarterly Summary (Unaudited)
The following table sets forth our unaudited consolidated financial results, for the last eight fiscal quarters:
Fiscal Year 2012
Quarters Ended
January 29,
2012 (A, B) October 30,
2011 (B) July 31,
2011 (B) May 1,
2011 (B)
(In thousands, except per share data)
Statement of Operations Data:
Revenue $ 953,194 $ 1,066,180 $ 1,016,517 $ 962,039
Cost of revenue $ 463,181 $ 509,463 $ 491,233 $ 477,536
Gross profit $ 490,013 $ 556,717 $ 525,284 $ 484,503
Net income $ 116,025 $ 178,273 $ 151,573 $ 135,219
Basic net income per share $ 0.19 $ 0.29 $ 0.25 $ 0.23
Diluted net income per share $ 0.19 $ 0.29 $ 0.25 $ 0.22
Fiscal Year 2011
Quarters Ended
January 30,
2011 (C) October 31,
2010 August 1,
2010 (D, E, F) May 2,
2010
(In thousands, except per share data)
Statement of Operations Data:
Revenue $ 886,376 $ 843,912 $ 811,208 $ 1,001,813
Cost of revenue $ 460,017 $ 451,850 $ 676,916 $ 545,436
Gross profit $ 426,359 $ 392,062 $ 134,292 $ 456,377
Net income (loss) $ 171,651 $ 84,862 $ (140,961) $ 137,594
Basic net income (loss) per share $ 0.29 $ 0.15 $ (0.25) $ 0.24
Diluted net income (loss) per share $ 0.29 $ 0.15 $ (0.25) $ 0.23
(A) Includes, an additional charge of $7.3 million associated with the fair value prescribed to the settlement between the Company and
Rambus. On February 7, 2012, the Company and Rambus entered into a licensing agreement and both parties also agreed to settle all
outstanding legal disputes.
(B) Includes other acquisition related costs including transaction costs, compensation charges and restructuring costs related to the
acquisition of Icera, Inc. of $1.3 million, $7.6 million, $6.4 million and $5.1 million for the first, second, third and fourth quarters of
fiscal year 2012, respectively.
(C) Includes a $57.0 million benefit, as a result of the Company and Intel entering into a new six -year cross licensing agreement. Both
parties also agreed to settle all outstanding legal disputes. Please refer to Note 4 of these Notes to the Consolidated Financial
Statements for details.
(D) Includes a $13.4 million benefit from an insurance provider as reimbursement for some claims against us towards the cost arising from
a weak die/packaging material set. Portions of the reimbursement are allocated to cost of revenue ($11.1 million) and legal expense
($2.3 million).
(E) Includes a $192.3 million warranty charge against cost of revenue arising from a weak die/packaging material set.
(F) Includes a $15.0 million charge related to a class action lawsuit settlement. Please refer to Note 14 of these Notes to the Consolidated
Financial Statements for details.
102