NVIDIA 2012 Annual Report Download - page 37
Download and view the complete annual report
Please find page 37 of the 2012 NVIDIA annual report below. You can navigate through the pages in the report by either clicking on the pages listed below, or by using the keyword search tool below to find specific information within the annual report.-
 1
1 -
2
-
3
-
4
-
5
-
6
-
7
-
8
-
9
-
10
-
11
-
12
-
13
-
14
-
15
-
16
-
17
-
18
-
19
-
20
-
21
-
22
-
23
-
24
-
25
-
26
-
 27
27 -
 28
28 -
 29
29 -
 30
30 -
 31
31 -
 32
32 -
 33
33 -
 34
34 -
 35
35 -
 36
36 -
 37
37 -
 38
38 -
 39
39 -
 40
40 -
 41
41 -
 42
42 -
 43
43 -
 44
44 -
 45
45 -
 46
46 -
 47
47 -
48
-
49
-
50
-
51
-
52
-
53
-
54
-
55
-
56
-
57
-
58
-
59
-
60
-
61
-
62
-
63
-
64
-
65
-
66
-
67
-
68
-
69
-
70
-
71
-
72
-
73
-
74
-
75
-
76
-
77
-
78
-
79
-
80
-
81
-
82
-
83
-
84
-
85
-
86
-
87
-
88
-
89
-
90
-
91
-
92
-
93
-
94
-
95
-
96
-
97
-
98
-
99
-
100
-
101
-
102
-
103
-
104
-
105
-
106
-
107
-
108
-
109
-
110
-
111
-
112
-
113
-
114
-
115
-
116
-
117
-
118
-
119
-
120
 |
 |

Table of Contents
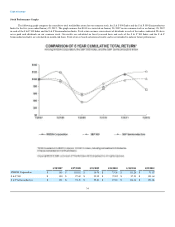
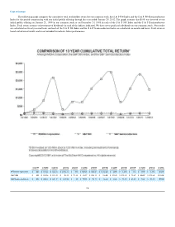
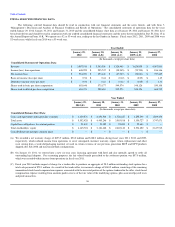
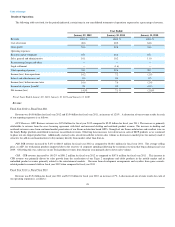
ITEM 6. SELECTED FINANCIAL DATA
The following selected financial data should be read in conjunction with our financial statements and the notes thereto, and with Item 7,
“Management’s Discussion and Analysis of Financial Condition and Results of Operations.” The consolidated statements of operations data for the years
ended January 29, 2012, January 30, 2011 and January 31, 2010 and the consolidated balance sheet data as of January 29, 2012 and January 30, 2011 have
been derived from and should be read in conjunction with our audited consolidated financial statements and the notes thereto included in Part IV, Item 15 in
this Annual Report on Form 10-K. We operate on a 52 or 53-week year, ending on the last Sunday in January. Fiscal years 2012, 2011, 2009 and 2008 were
52-week years, while fiscal year 2010 was a 53-week year.
Year Ended
January 29,
2012 January 30,
2011 (A,B) January 31,
2010 (A,C) January 25,
2009 (A,D) January 27,
2008
(In thousands, except per share data)
Consolidated Statement of Operations Data:
Revenue $ 3,997,930 $ 3,543,309 $ 3,326,445 $ 3,424,859 $ 4,097,860
Income (loss) from operations $ 648,299 $ 255,747 $ (98,945) $ (70,700) $ 836,346
Net income (loss) $ 581,090 $ 253,146 $ (67,987) $ (30,041) $ 797,645
Basic net income (loss) per share $ 0.96 $ 0.44 $ (0.12) $ (0.05) $ 1.45
Diluted net income (loss) per share $ 0.94 $ 0.43 $ (0.12) $ (0.05) $ 1.31
Shares used in basic per share computation 603,646 575,177 549,574 548,126 550,108
Shares used in diluted per share computation 616,371 588,684 549,574 548,126 606,732
Year Ended
January 29,
2012 (E) January 30,
2011 January 31,
2010 January 25,
2009 January 27,
2008
(In thousands, except per share data)
Consolidated Balance Sheet Data:
Cash, cash equivalents and marketable securities $ 3,129,576 $ 2,490,563 $ 1,728,227 $ 1,255,390 $ 1,809,478
Total assets $ 5,552,928 $ 4,495,246 $ 3,585,918 $ 3,350,727 $ 3,747,671
Capital lease obligations, less current portion $ 21,439 $ 23,389 $ 24,450 $ 25,634 $ —
Total stockholders’ equity $ 4,145,724 $ 3,181,462 $ 2,665,140 $ 2,394,652 $ 2,617,912
Cash dividends declared per common share $ — $ — $ — $ — $ —
(A) We recorded a net warranty charge of $193.9 million, $94.0 million and $188.0 million, during fiscal years 2011, 2010 and 2009,
respectively, which reduced income from operations to cover anticipated customer warranty, repair, return, replacement and other
costs arising from a weak die/packaging material set used in certain versions of our previous generation MCP and GPU products
shipped after July 2008 and used in notebook configurations.
(B) On January 10, 2011, we entered into a new six-year cross licensing agreement with Intel and also mutually agreed to settle all
outstanding legal disputes. For accounting purposes, the fair valued benefit prescribed to the settlement portion was $57.0 million,
which was recorded within income from operations in fiscal year 2011.
(C) Fiscal year 2010 includes impact of charge for a tender offer to purchase an aggregate of 28.5 million outstanding stock options for a
total cash payment of $78.1 million. As a result of the tender offer, we incurred a charge of $140.2 million, consisting of the remaining
unamortized stock-based compensation expenses associated with the unvested portion of the options tendered in the offer, stock-based
compensation expense resulting from amounts paid in excess of the fair value of the underlying options, plus associated payroll taxes
and professional fees.
36