NVIDIA 2012 Annual Report Download - page 48
Download and view the complete annual report
Please find page 48 of the 2012 NVIDIA annual report below. You can navigate through the pages in the report by either clicking on the pages listed below, or by using the keyword search tool below to find specific information within the annual report.-
 1
1 -
2
-
3
-
4
-
5
-
6
-
7
-
8
-
9
-
10
-
11
-
12
-
13
-
14
-
15
-
16
-
17
-
18
-
19
-
20
-
21
-
22
-
23
-
24
-
25
-
26
-
27
-
28
-
29
-
30
-
31
-
32
-
33
-
34
-
35
-
36
-
37
-
 38
38 -
 39
39 -
 40
40 -
 41
41 -
 42
42 -
 43
43 -
 44
44 -
 45
45 -
 46
46 -
 47
47 -
 48
48 -
 49
49 -
 50
50 -
 51
51 -
 52
52 -
 53
53 -
 54
54 -
 55
55 -
 56
56 -
 57
57 -
 58
58 -
59
-
60
-
61
-
62
-
63
-
64
-
65
-
66
-
67
-
68
-
69
-
70
-
71
-
72
-
73
-
74
-
75
-
76
-
77
-
78
-
79
-
80
-
81
-
82
-
83
-
84
-
85
-
86
-
87
-
88
-
89
-
90
-
91
-
92
-
93
-
94
-
95
-
96
-
97
-
98
-
99
-
100
-
101
-
102
-
103
-
104
-
105
-
106
-
107
-
108
-
109
-
110
-
111
-
112
-
113
-
114
-
115
-
116
-
117
-
118
-
119
-
120
 |
 |

Table of Contents
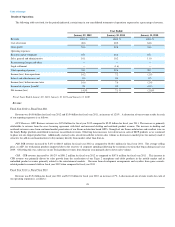
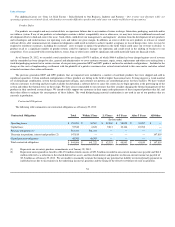
Fiscal Year 2012 vs. Fiscal Year 2011
Our gross margin increased to 51.4% in fiscal year 2012 from 39.8% in fiscal year 2011. The improvement in gross margin was driven primarily due to
increased unit sales and a richer product mix of our desktop GPU and notebook GeForce GPU products and workstation products and the addition of revenue
in the current year from the cross licensing arrangement with Intel. Manufacturing cost efficiencies and strong management of inventory also helped margin
improve in the current fiscal year. Other favorable impacts to gross margin were the absence in fiscal year 2012 of a net charge to cost of revenue in the
amount of $181.2 million recorded in fiscal year 2011 related to a weak die/packing material set and lower provisions for net inventory reserves in fiscal year
2012 compared to fiscal year 2011.
Our gross margin was favorably impacted by sales of products that were previously written down and sales of such items improved gross margin by
approximately 1.8% and 1.9% in fiscal years 2012 and 2011, respectively. Offsetting these releases are provisions for new inventory reserves. The net effect
to gross margin from inventory reserves and sales of items previously written down was a 0.5% favorable impact in fiscal year 2012 and 3.0% unfavorable
impact in fiscal year 2011.
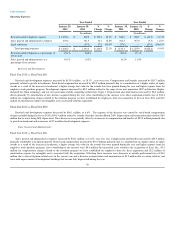
GPU Business. The gross margin of our GPU Business increased during fiscal year 2012 when compared to fiscal year 2011. This was primarily due to
lower provisions for net inventory reserves in fiscal year 2012 compared to fiscal year 2011 and additional warranty accruals arising from a weak die/
packaging material set recorded in fiscal year 2011. Revenue from our cross licensing arrangement with Intel also contributed to gross margin increase. In
addition, higher unit sales and richer product mix of our desktop and notebook GeForce GPU products also improved gross margin for the GPU business.
PSB . The gross margin of our PSB remained stable during fiscal year 2012 as compared to fiscal year 2011 for both Quadro and Tesla products.
CPB. The gross margin of our CPB decreased during fiscal year 2012 as compared to fiscal year 2011. This decrease was a result of a change in product
mix driven by a lower mix of revenue from higher margin products and services such as development arrangements and royalties from game console-related
products and a higher mix of revenue from our Tegra products, which grew substantially during the year.
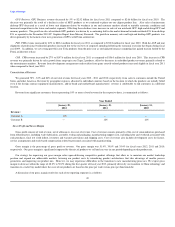
Fiscal Year 2011 vs. Fiscal Year 2010
Our gross margin increased to 39.8% in fiscal year 2011 from 35.4% for fiscal year 2010. The improvement in gross margin was driven primarily due to
increased unit sales, mix and better ASPs of our high-end desktop GPU, notebook GPU and workstation products. Cost efficiencies and pricing decisions also
helped margin improve in the current fiscal year. Additionally, fiscal year 2010 included $11.4 million charge related to the our tender offer to purchase
certain stock options for personnel related to manufacturing which resulted in an adverse impact on gross margins that did not occur in fiscal year 2011.
Offsetting these favorable impacts, we recorded a net charge to cost of revenue in the amount of $181.2 million in fiscal year 2011 compared to $95.9
million in fiscal year 2010 related to a weak die/packing material set that was used in certain versions of our previous generation chips. Our gross margin
was favorably impacted by sales of products that were previously written down and sales of such items improved gross margin by approximately 1.9% and
1.6% in fiscal years 2011 and 2010, respectively. Offsetting these releases are provisions for new inventory reserves. The net effect to gross margin from
inventory reserves and sales of items previously written down was a 3.0% unfavorable impact in fiscal year 2011 and a 0.2% favorable impact in fiscal year
2010.
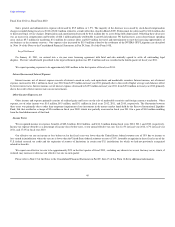
GPU Business. The gross margin of our GPU Business remained comparable during fiscal year 2011 and fiscal year 2010. While higher inventory
reserves due to future demand concerns in the first half of fiscal year 2011 and additional warranty accruals arising from a weak die/packaging material set
reduced gross margin for fiscal year 2011 when compared to fiscal year 2010, this was more than offset by higher unit sales, mix and ASPs in the high-end
desktop and notebook product lines.
PSB. The gross margin of our PSB remained flat during fiscal year 2011 as compared to fiscal year 2010. Improvements in gross margin as a result of
better ASPs and shipment volumes in our Quadro product line were offset by higher inventory reserves recorded in fiscal year 2011, when compared to fiscal
year 2010. Tesla gross margin improved due to better production efficiencies was driven by lower product cost and higher unit sales, while ASPs remained
stable.
CPB. The gross margin of our CPB increased during fiscal year 2011 as compared to fiscal year 2010. This increase was a result of better ASPs and
higher unit shipment of our Tegra products as well as slightly better revenue from higher margin products and services, including development arrangements
and royalties from game console-related products, in the comparative periods.
47