NVIDIA 2012 Annual Report Download - page 49
Download and view the complete annual report
Please find page 49 of the 2012 NVIDIA annual report below. You can navigate through the pages in the report by either clicking on the pages listed below, or by using the keyword search tool below to find specific information within the annual report.-
 1
1 -
2
-
3
-
4
-
5
-
6
-
7
-
8
-
9
-
10
-
11
-
12
-
13
-
14
-
15
-
16
-
17
-
18
-
19
-
20
-
21
-
22
-
23
-
24
-
25
-
26
-
27
-
28
-
29
-
30
-
31
-
32
-
33
-
34
-
35
-
36
-
37
-
38
-
 39
39 -
 40
40 -
 41
41 -
 42
42 -
 43
43 -
 44
44 -
 45
45 -
 46
46 -
 47
47 -
 48
48 -
 49
49 -
 50
50 -
 51
51 -
 52
52 -
 53
53 -
 54
54 -
 55
55 -
 56
56 -
 57
57 -
 58
58 -
 59
59 -
60
-
61
-
62
-
63
-
64
-
65
-
66
-
67
-
68
-
69
-
70
-
71
-
72
-
73
-
74
-
75
-
76
-
77
-
78
-
79
-
80
-
81
-
82
-
83
-
84
-
85
-
86
-
87
-
88
-
89
-
90
-
91
-
92
-
93
-
94
-
95
-
96
-
97
-
98
-
99
-
100
-
101
-
102
-
103
-
104
-
105
-
106
-
107
-
108
-
109
-
110
-
111
-
112
-
113
-
114
-
115
-
116
-
117
-
118
-
119
-
120
 |
 |
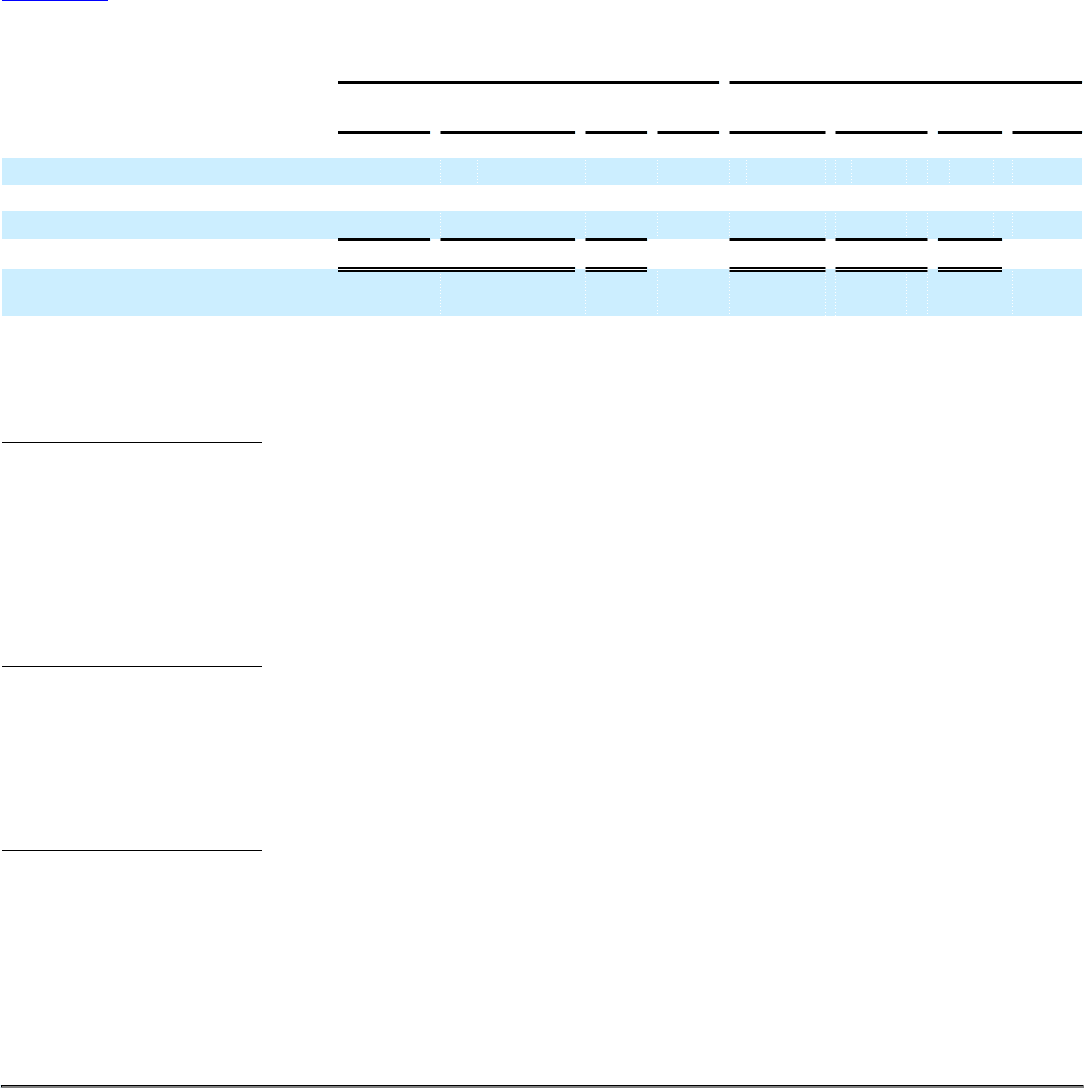
Table of Contents
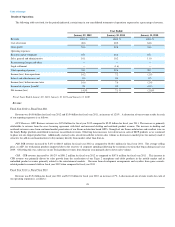
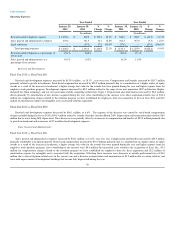
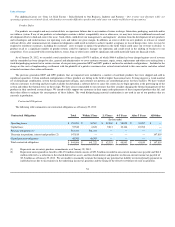
Operating Expenses
Year Ended Year Ended
January 29,
2012 January 30,
2011 $
Change %
Change January 30,
2011 January 31,
2010 $
Change %
Change
(In millions) (In millions)
Research and development expenses $ 1,002.6 $ 848.8 $ 153.8 18.1% $ 848.8 $ 908.9 $ (60.1) (6.6)%
Sales, general and administrative expenses 405.6 361.5 44.1 12.2% 361.5 367.0 (5.5) (1.5)%
Legal settlement — (57.0) 57.0 100.0% (57.0) — (57.0) (100.0)%
Total operating expenses $ 1,408.2 $ 1,153.3 $ 254.9 22.1% $ 1,153.3 $ 1,275.9 $(122.6) (9.6)%
Research and development as a percentage of
net revenue 25.1% 24.0% 24.0% 27.3%
Sales, general and administrative as a
percentage of net revenue 10.1% 10.2% 10.2% 11.0%
Research and Development
Fiscal Year 2012 vs. Fiscal Year 2011
Research and development expenses increased by $153.8 million , or 18.1% , year over year. Compensation and benefits increased by $83.7 million
primarily related to growth in headcount. Stock based compensation increased by $22.5 million primarily due to a combination of a higher outlay of equity
awards as a result of the increase in headcount, a higher average fair value for the awards that were granted during the year and higher expense from the
employee stock purchase program. Development expenses increased by $9.0 million related to the ramp of our next-generation GPU architecture, Kepler,
designed for 28nm technology and our next generation mobile computing architecture, Tegra 3. Depreciation and amortization increased by $8.8 million,
driven primarily by amortization of new licenses acquired during the year. Also contributing to the increase were other acquisition-related costs of $12.4
million for compensation charges related to the retention program we have established for employees from our acquisition of Icera in June 2011 and $6.0
million of amortization expense for intangible assets associated with this acquisition.
Fiscal Year 2011 vs. Fiscal Year 2010
Research and development expenses decreased by $60.1 million, or 6.6%. The majority of the decrease was caused by stock-based compensation
charges recorded during fiscal year 2010 of $90.5 million related to a tender offer that closed in March 2009. Depreciation and amortization decreased by $8.9
million due to assets being fully depreciated. These decreases were partially offset by an increase in compensation and benefits of $23.5 million primarily due
to growth in headcount and an increase of $7.6 million for development expenses.
Sales, General and Administrative
Fiscal Year 2012 vs. Fiscal Year 2011
Sales, general and administrative expenses increased by $44.1 million, or 12.2%, year over year. Compensation and benefits increased by $29.5 million
primarily attributable to headcount growth. Stock-based compensation increased by $10.5 million primarily due to a combination of a higher outlay of equity
awards as a result of the increase in headcount, a higher average fair value for the awards that were granted during the year and higher expense from the
employee stock purchase program. Also contributing to the increase were $4.4 million for transaction costs related to the acquisition of Icera, Inc., $3.5
million for compensation charges related to the retention program we have established for employees from the Icera acquisition and $2.2 million of
amortization expense for intangible assets associated with this acquisition. Offsetting these increases were decreases in outside professional fees of $4.0
million due to lower litigation-related costs in the current year and a decrease in depreciation and amortization of $9.2 million due to certain software and
lease hold improvements of headquarters buildings that became fully depreciated during the year.
48