NVIDIA 2012 Annual Report Download - page 51
Download and view the complete annual report
Please find page 51 of the 2012 NVIDIA annual report below. You can navigate through the pages in the report by either clicking on the pages listed below, or by using the keyword search tool below to find specific information within the annual report.-
 1
1 -
2
-
3
-
4
-
5
-
6
-
7
-
8
-
9
-
10
-
11
-
12
-
13
-
14
-
15
-
16
-
17
-
18
-
19
-
20
-
21
-
22
-
23
-
24
-
25
-
26
-
27
-
28
-
29
-
30
-
31
-
32
-
33
-
34
-
35
-
36
-
37
-
38
-
39
-
40
-
 41
41 -
 42
42 -
 43
43 -
 44
44 -
 45
45 -
 46
46 -
 47
47 -
 48
48 -
 49
49 -
 50
50 -
 51
51 -
 52
52 -
 53
53 -
 54
54 -
 55
55 -
 56
56 -
 57
57 -
 58
58 -
 59
59 -
 60
60 -
 61
61 -
62
-
63
-
64
-
65
-
66
-
67
-
68
-
69
-
70
-
71
-
72
-
73
-
74
-
75
-
76
-
77
-
78
-
79
-
80
-
81
-
82
-
83
-
84
-
85
-
86
-
87
-
88
-
89
-
90
-
91
-
92
-
93
-
94
-
95
-
96
-
97
-
98
-
99
-
100
-
101
-
102
-
103
-
104
-
105
-
106
-
107
-
108
-
109
-
110
-
111
-
112
-
113
-
114
-
115
-
116
-
117
-
118
-
119
-
120
 |
 |

Table of Contents
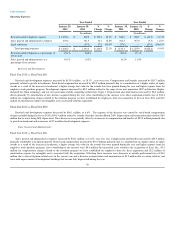
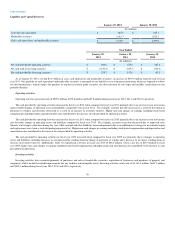
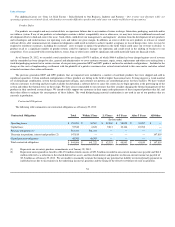
Liquidity and Capital Resources
January 29, 2012 January 30, 2011
(In millions)
Cash and cash equivalents $ 667.9 $ 665.4
Marketable securities 2,461.7 1,825.2
Cash, cash equivalents, and marketable securities $ 3,129.6 $ 2,490.6
Year Ended
January 29,
2012 January 30,
2011 January 31,
2010
(In millions)
Net cash provided by operating activities $ 909.2 $ 675.8 $ 487.8
Net cash used in investing activities $ (1,143.4) $ (649.7) $ (519.3)
Net cash provided by financing activities $ 236.7 $ 192.0 $ 61.1
As of January 29, 2012, we had $3.13 billion in cash, cash equivalents and marketable securities, an increase of $639.0 million from the end of fiscal
year 2011. Our portfolio of cash equivalents and marketable securities is managed on our behalf by several financial institutions which are required to follow
our investment policy, which requires the purchase of top-tier investment grade securities, the diversification of asset types and includes certain limits on our
portfolio duration.
Operating activities
Operating activities generated cash of $909.2 million, $675.8 million and $487.8 million during fiscal years 2012, 2011 and 2010, respectively.
The cash provided by operating activities increased in fiscal year 2012 when compared to fiscal year 2011 primarily due to an increase in our net income
and favorable changes in operating assets and liabilities compared to fiscal year 2011. For example, accounts payable increased as a result of the timing of
payments to vendors and inventory decreased as a result of an increase in inventory turnover. Higher non-cash charges in earnings including stock-based
compensation and depreciation and amortization also contributed to the increase in cash provided by operating activities.
The cash provided by operating activities increased in fiscal year 2011 when compared to fiscal year 2010 primarily due to an increase in our net income
and favorable changes in operating assets and liabilities compared to fiscal year 2010. For example, accounts receivable decreased due to improved sales
linearity and stronger collections during the year, while accrued and other liabilities increased primarily due to an additional net charge for incremental repair
and replacement costs from a weak die/packaging material set. Higher non-cash charges in earnings including stock-based compensation and depreciation and
amortization also contributed to the increase in cash provided by operating activities.
The cash provided by operating activities in fiscal year 2010 increased when compared to fiscal year 2009 was primarily due to changes in operating
assets and liabilities, including increases in accounts payable resulting from the timing of payments to vendors and a decrease in inventory resulting from an
increase in inventory turnover. Additionally, while we experienced a net loss in fiscal year 2010 of $68.0 million, versus a net loss of $30.0 million in fiscal
year 2009, higher non-cash charges to earnings included stock-based compensation and depreciation and amortization also contributed to the increase in cash
provided from operations.
Investing activities
Investing activities have consisted primarily of purchases and sales of marketable securities, acquisition of businesses and purchases of property and
equipment, which include leasehold improvements for our facilities and intangible assets. Investing activities used cash of $1,143.4 million, $649.7 million
and $519.3 million during fiscal years 2012, 2011 and 2010, respectively.
50