NVIDIA 2012 Annual Report Download - page 50
Download and view the complete annual report
Please find page 50 of the 2012 NVIDIA annual report below. You can navigate through the pages in the report by either clicking on the pages listed below, or by using the keyword search tool below to find specific information within the annual report.-
 1
1 -
2
-
3
-
4
-
5
-
6
-
7
-
8
-
9
-
10
-
11
-
12
-
13
-
14
-
15
-
16
-
17
-
18
-
19
-
20
-
21
-
22
-
23
-
24
-
25
-
26
-
27
-
28
-
29
-
30
-
31
-
32
-
33
-
34
-
35
-
36
-
37
-
38
-
39
-
 40
40 -
 41
41 -
 42
42 -
 43
43 -
 44
44 -
 45
45 -
 46
46 -
 47
47 -
 48
48 -
 49
49 -
 50
50 -
 51
51 -
 52
52 -
 53
53 -
 54
54 -
 55
55 -
 56
56 -
 57
57 -
 58
58 -
 59
59 -
 60
60 -
61
-
62
-
63
-
64
-
65
-
66
-
67
-
68
-
69
-
70
-
71
-
72
-
73
-
74
-
75
-
76
-
77
-
78
-
79
-
80
-
81
-
82
-
83
-
84
-
85
-
86
-
87
-
88
-
89
-
90
-
91
-
92
-
93
-
94
-
95
-
96
-
97
-
98
-
99
-
100
-
101
-
102
-
103
-
104
-
105
-
106
-
107
-
108
-
109
-
110
-
111
-
112
-
113
-
114
-
115
-
116
-
117
-
118
-
119
-
120
 |
 |

Table of Contents
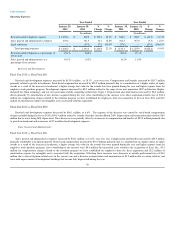
Fiscal Year 2011 vs. Fiscal Year 2010
Sales, general and administrative expenses decreased by $5.5 million, or 1.5%. The majority of the decrease was caused by stock-based compensation
charges recorded during fiscal year 2010 of $38.3 million related to a tender offer that closed in March 2009. Professional fees decreased by $10.6 million due
to decreased legal service charges. Depreciation and amortization decreased by $4.2 million due to assets being fully depreciated. Offsetting these decreases
was an increase in compensation and benefits of $28.1 million primarily attributable to growth in headcount. We had increases across discretionary spending
areas such as $5.7 million for marketing, $3.2 million for contract labor, and $2.9 million for travel and entertainment to meet the increasing opportunities of
our business as the economy recovers. Our expenses also increased by $15.0 million related to the settlement of the NVIDIA GPU Litigation case described
in Note 14 of the Notes to the Consolidated Financial Statements in Part IV, Item 15 of this Form 10-K.
Legal Settlement
On January 10, 2011, we entered into a six-year cross licensing agreement with Intel and also mutually agreed to settle all outstanding legal
disputes. The fair valued benefit prescribed to the legal settlement portion was $57.0 million and was recorded in the fourth quarter of fiscal year 2011.
We expect operating expenses to be approximately $383 million in the first quarter of fiscal year 2013.
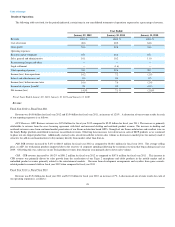
Interest Income and Interest Expense
Interest income, net of interest expense consists of interest earned on cash, cash equivalents and marketable securities. Interest income, net of interest
expense, increased to $16.1 million in fiscal year 2012 from $15.9 million in fiscal year 2011 primarily due to the result of higher average cash balances offset
by lower interest rates. Interest income, net of interest expense, decreased to $15.9 million in fiscal year 2011 from $19.8 million in fiscal year 2010 primarily
due to the result of lower interest rates on our investments.
Other Income (Expense), net
Other income and expense primarily consists of realized gains and losses on the sale of marketable securities and foreign currency translation. Other
expense, net of other income was $1.0 million, $0.5 million, and $3.1 million in fiscal years 2012, 2011, and 2010, respectively. The fluctuation between
these years was primarily due to other than temporary impairment of our investment in the money market funds held by the Reserve International Liquidity
Fund, Ltd. that resulted in a charge of $5.6 million in fiscal year 2009, which was partially recovered in fiscal year 2011 for a gain of $3.0 million resulting
from the final disbursement of this fund.
Income Taxes
We recognized income tax expense (benefit) of $82.3 million, $18.0 million, and $(14.3) million during fiscal years 2012, 2011, and 2010, respectively.
Income tax expense (benefit) as a percentage of income (loss) before taxes, or our annual effective tax rate, was 12.4% in fiscal year 2012, 6.7% in fiscal year
2011, and 17.4% in fiscal year 2010.
Our effective tax rate on income or loss before tax for the fiscal years was lower than the United States federal statutory rate of 35% due to income or
loss earned in jurisdictions where the tax rate is lower than the United States federal statutory tax rate of 35%, favorable recognition in these fiscal years of the
U.S. federal research tax credit and the expiration of statutes of limitations in certain non-U.S. jurisdictions for which we had not previously recognized
related tax benefits.
We expect our effective tax rate to be approximately 20% in the first quarter of fiscal 2013, excluding any discrete tax events that may occur, which, if
realized, may increase or decrease our effective tax rate in such quarter.
Please refer to Note 15 of the Notes to the Consolidated Financial Statements in Part IV, Item 15 of this Form 10-K for additional information.
49