NVIDIA 2012 Annual Report Download - page 66
Download and view the complete annual report
Please find page 66 of the 2012 NVIDIA annual report below. You can navigate through the pages in the report by either clicking on the pages listed below, or by using the keyword search tool below to find specific information within the annual report.-
 1
1 -
2
-
3
-
4
-
5
-
6
-
7
-
8
-
9
-
10
-
11
-
12
-
13
-
14
-
15
-
16
-
17
-
18
-
19
-
20
-
21
-
22
-
23
-
24
-
25
-
26
-
27
-
28
-
29
-
30
-
31
-
32
-
33
-
34
-
35
-
36
-
37
-
38
-
39
-
40
-
41
-
42
-
43
-
44
-
45
-
46
-
47
-
48
-
49
-
50
-
51
-
52
-
53
-
54
-
55
-
 56
56 -
 57
57 -
 58
58 -
 59
59 -
 60
60 -
 61
61 -
 62
62 -
 63
63 -
 64
64 -
 65
65 -
 66
66 -
 67
67 -
 68
68 -
 69
69 -
 70
70 -
 71
71 -
 72
72 -
 73
73 -
 74
74 -
 75
75 -
 76
76 -
77
-
78
-
79
-
80
-
81
-
82
-
83
-
84
-
85
-
86
-
87
-
88
-
89
-
90
-
91
-
92
-
93
-
94
-
95
-
96
-
97
-
98
-
99
-
100
-
101
-
102
-
103
-
104
-
105
-
106
-
107
-
108
-
109
-
110
-
111
-
112
-
113
-
114
-
115
-
116
-
117
-
118
-
119
-
120
 |
 |
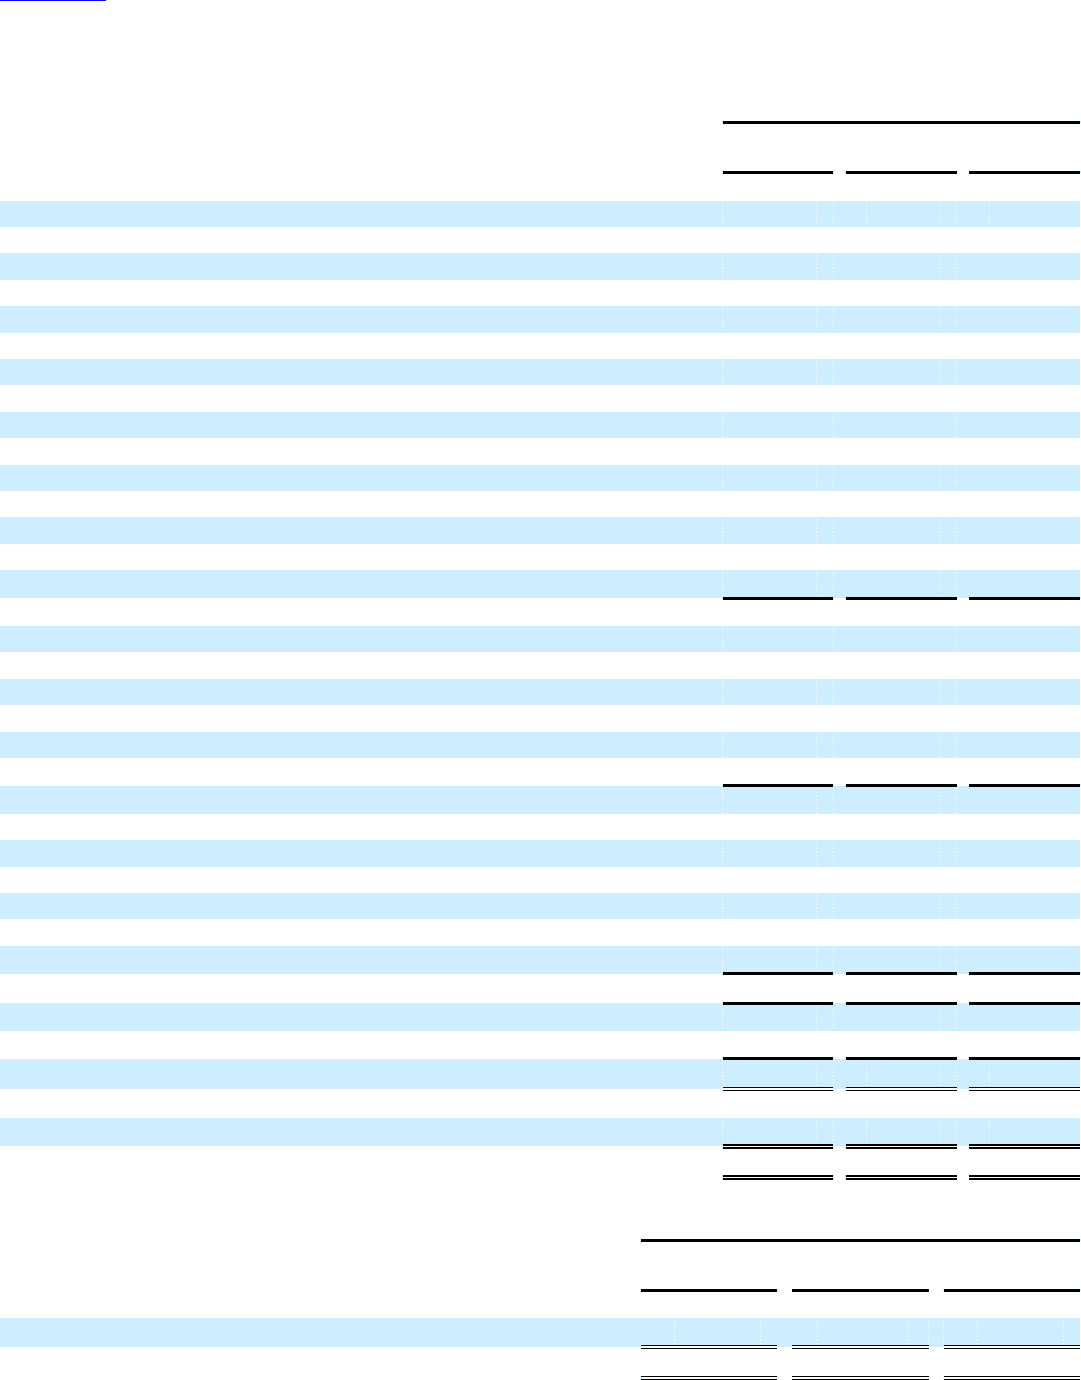
Table of Contents
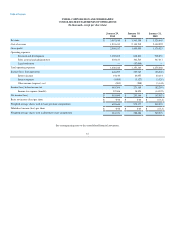
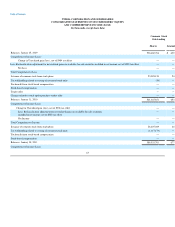
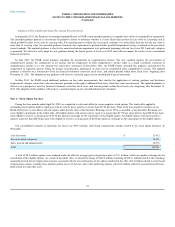
NVIDIA CORPORATION AND SUBSIDIARIES
CONSOLIDATED STATEMENTS OF CASH FLOWS
(In thousands)
Year ended
January 29,
2012 January 30,
2011 January 31,
2010
Cash flows from operating activities:
Net income (loss) $ 581,090 $ 253,146 $ (67,987)
Adjustments to reconcile net income (loss) to net cash provided by operating activities:
Stock-based compensation expense related to stock option purchase — — 135,735
Stock-based compensation expense 136,354 100,353 107,091
Depreciation and amortization 204,205 186,989 196,664
Deferred income taxes 19,056 (2,646) (21,147)
Tax benefit from stock based compensation (52,793) (15,316) (2,034)
Other 19,095 1,572 3,070
Changes in operating assets and liabilities, net of effects of acquisitions:
Accounts receivable 26,236 26,341 (56,741)
Inventories 18,884 (14,128) 204,656
Prepaid expenses and other current assets (14,803) 8,528 1,580
Deposits and other assets (70,694) 4,331 3,857
Accounts payable 35,708 (69,786) 119,366
Accrued liabilities and other long-term liabilities 6,818 196,413 (136,303)
Net cash provided by operating activities 909,156 675,797 487,807
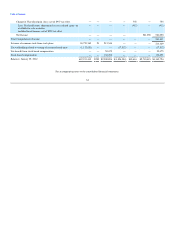
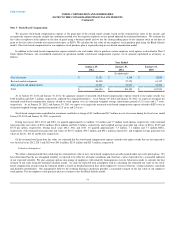
Cash flows from investing activities:
Purchases of marketable securities (1,964,898) (1,719,700) (1,193,948)
Proceeds from sales and maturities of marketable securities 1,310,743 1,170,075 752,434
Purchases of property and equipment and intangible assets (138,735) (97,890) (77,601)
Acquisition of businesses, net of cash and cash equivalents (348,884) — —
Other (1,590) (2,163) (218)
Net cash used in investing activities (1,143,364) (649,678) (519,333)
Cash flows from financing activities:
Payments related to stock option purchase — — (78,075)
Proceeds from issuance of common stock under employee stock plans 195,857 177,276 138,029
Tax benefit from stock based compensation 52,793 15,316 2,034
Payment of notes payable assumed from acquisition (10,319) — —
Payments under capital lease obligations (1,608) (571) (929)
Net cash provided by financing activities 236,723 192,021 61,059
Change in cash and cash equivalents 2,515 218,140 29,533
Cash and cash equivalents at beginning of period 665,361 447,221 417,688
Cash and cash equivalents at end of period $ 667,876 $ 665,361 $ 447,221
Supplemental disclosures of cash flow information:
Cash paid for income taxes, net $ 58,328 $ (1,071) $ 4,217
Cash paid for interest on capital lease obligations $ 3,008 $ 3,127 $ 3,256
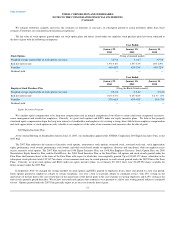
Year Ended
January 29,
2012 January 30,
2011 January 31,
2010
Non-cash activities:
Change in unrealized gains (losses) from marketable securities $ 342 $ (1,899) $ 8,305
Assets acquired by assuming related liabilities $ 15,913 $ 252,796 $ 37,830