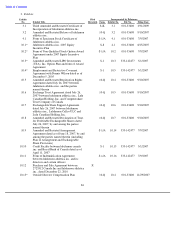
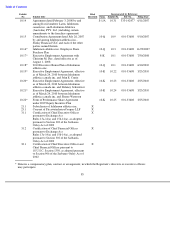
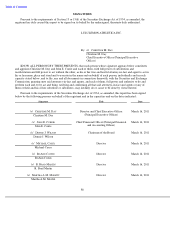
Lululemon 2010 Annual Report Download - page 81
Download and view the complete annual report
Please find page 81 of the 2010 Lululemon annual report below. You can navigate through the pages in the report by either clicking on the pages listed below, or by using the keyword search tool below to find specific information within the annual report.-
 1
1 -
2
-
3
-
4
-
5
-
6
-
7
-
8
-
9
-
10
-
11
-
12
-
13
-
14
-
15
-
16
-
17
-
18
-
19
-
20
-
21
-
22
-
23
-
24
-
25
-
26
-
27
-
28
-
29
-
30
-
31
-
32
-
33
-
34
-
35
-
36
-
37
-
38
-
39
-
40
-
41
-
42
-
43
-
44
-
45
-
46
-
47
-
48
-
49
-
50
-
51
-
52
-
53
-
54
-
55
-
56
-
57
-
58
-
59
-
60
-
61
-
62
-
63
-
64
-
65
-
66
-
67
-
68
-
69
-
70
-
 71
71 -
 72
72 -
 73
73 -
 74
74 -
 75
75 -
 76
76 -
 77
77 -
 78
78 -
 79
79 -
 80
80 -
 81
81 -
 82
82 -
 83
83 -
 84
84 -
 85
85 -
 86
86 -
 87
87 -
 88
88 -
 89
89 -
 90
90 -
 91
91 -
92
-
93
-
94
-
95
-
96
-
97
-
98
-
99
-
100
-
101
-
102
-
103
-
104
-
105
-
106
-
107
-
108
-
109
-
110
-
111
-
112
-
113
-
114
-
115
-
116
-
117
-
118
-
119
-
120
-
121
-
122
-
123
-
124
-
125
-
126
-
127
-
128
-
129
-
130
-
131
-
132
-
133
-
134
-
135
-
136
-
137
 |
 |

Table of Contents
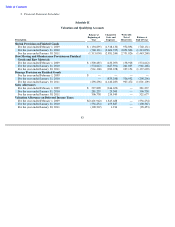
lululemon athletica inc. and Subsidiaries
NOTES TO THE CONSOLIDATED FINANCIAL STATEMENTS — (Continued)
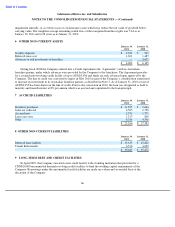
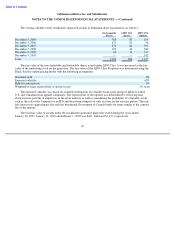
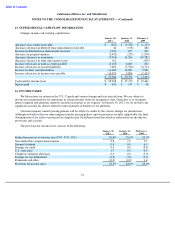
activities, U.S. franchise activities and wholesale sales to the Company’s U.S. stores and to third parties. Previously,
the Company reported its franchise channel as an operating segment, however it has accounted for less than 10% of
net revenue from operations in each of fiscal 2009 and fiscal 2008. Opening new franchise stores is not a significant
part of the Company’s near-term growth strategy and the Company does not expect that the revenue derived from
franchises to be greater than 10% of net revenue in future years. Therefore, the Company has re-evaluated segment
reporting in the first quarter of fiscal 2010. The Company’s reportable segments are comprised of corporate-owned
stores, direct to consumer and other. Direct to consumer includes sales from the Company’s e-commerce
website and
phone sales. Franchise sales, wholesale, showrooms sales and outlet sales have been combined into other.
Information for these segments is detailed in the table below:
The intercompany wholesale sales of $10,188, $5,504, and $5,746 for the years ended January 30, 2011,
January 31, 2010, and February 1, 2009 respectively, have been excluded from the net revenue in the Other
reportable segment. In addition, the income from operations reported included in the segment results for Other does
not reflect the intercompany profit on these sales, which amounted to $931, $30, and $158 for the years ended
January 30, 2011, January 31, 2010, and February 1, 2009, respectively.
76
Fiscal Year Ended
January 30,
January 31,
February 1,
2011
2010
2009
Net revenue
Corporate
-
owned stores
$
591,031
$
393,451
$
315,548
Direct to Consumer
57,348
18,257
1,629
Other
63,325
41,190
36,311
$
711,704
$
452,898
$
353,488
Income from operations before general corporate expense
Corporate
-
owned stores
$
215,154
$
121,614
$
94,867
Direct to Consumer
16,364
6,288
663
Other
18,004
10,845
11,549
$
249,522
$
138,747
$
107,079
General corporate expense
69,131
52,201
50,515
Net operating income
180,391
86,546
56,564
Other income (expense), net
2,886
164
821
Income before income taxes
$
183,277
$
86,710
$
57,385
Capital expenditures
Corporate
-
owned stores
$
14,536
$
10,172
$
29,588
Direct to consumer
4,626
—
—
Corporate
11,195
5,325
10,942
$
30,357
$
15,497
$
40,530
Depreciation and amortization
Corporate
-
owned stores
$
16,335
$
13,721
$
10,557
Corporate
8,279
7,111
5,266
$
24,614
$
20,832
$
15,823