Lululemon 2010 Annual Report Download - page 38
Download and view the complete annual report
Please find page 38 of the 2010 Lululemon annual report below. You can navigate through the pages in the report by either clicking on the pages listed below, or by using the keyword search tool below to find specific information within the annual report.-
 1
1 -
2
-
3
-
4
-
5
-
6
-
7
-
8
-
9
-
10
-
11
-
12
-
13
-
14
-
15
-
16
-
17
-
18
-
19
-
20
-
21
-
22
-
23
-
24
-
25
-
26
-
27
-
 28
28 -
 29
29 -
 30
30 -
 31
31 -
 32
32 -
 33
33 -
 34
34 -
 35
35 -
 36
36 -
 37
37 -
 38
38 -
 39
39 -
 40
40 -
 41
41 -
 42
42 -
 43
43 -
 44
44 -
 45
45 -
 46
46 -
 47
47 -
 48
48 -
49
-
50
-
51
-
52
-
53
-
54
-
55
-
56
-
57
-
58
-
59
-
60
-
61
-
62
-
63
-
64
-
65
-
66
-
67
-
68
-
69
-
70
-
71
-
72
-
73
-
74
-
75
-
76
-
77
-
78
-
79
-
80
-
81
-
82
-
83
-
84
-
85
-
86
-
87
-
88
-
89
-
90
-
91
-
92
-
93
-
94
-
95
-
96
-
97
-
98
-
99
-
100
-
101
-
102
-
103
-
104
-
105
-
106
-
107
-
108
-
109
-
110
-
111
-
112
-
113
-
114
-
115
-
116
-
117
-
118
-
119
-
120
-
121
-
122
-
123
-
124
-
125
-
126
-
127
-
128
-
129
-
130
-
131
-
132
-
133
-
134
-
135
-
136
-
137
 |
 |

Table of Contents
continue to generate interest income to the extent that our cash generated from operations exceeds our cash used for
investment. We have maintained relatively small outstanding balances on our credit facilities and expect to continue
to do so.
Provision for income taxes depends on the statutory tax rates in the countries where we sell our products.
Historically we have generated taxable income in Canada and we have generated tax losses in the United States. For
periods up to and including the second quarter of fiscal 2007, we recorded a full valuation allowance against our
losses in the United States. In the third and fourth quarters of fiscal 2007, we earned taxable income in the United
States. During the second quarter of fiscal 2008, after considering a number of factors, including recent taxable
income, utilization of previously unrealized net operating losses, or NOLs, our growth strategy as well as other
business and macroeconomic factors, we determined that we would more likely than not realize the benefit of
deferred tax assets through future taxable income. We have recorded deferred tax assets in respect of foreign tax
credits and other deductible temporary differences of $7.9 million as at January 30, 2011.
Several factors have contributed to our effective tax rate fluctuating in recent periods. First, in fiscal 2008 and
fiscal 2007, we generated losses in the United States which we were unable to offset against our income in Canada.
Second, we incurred stock-based compensation expense of $7.3 million, $5.6 million and $6.5 million in fiscal 2010,
fiscal 2009 and fiscal 2008, respectively, a portion of which were not deductible for tax purposes in Canada and the
United States during these periods. Third, the Canadian corporate tax rate decreased from 35% to 32% in fiscal 2008.
Fourth, in fiscal 2008 we began to release the valuation against US loss carry forwards. Our effective tax rate in
fiscal 2010 was 33%, compared to 33% in fiscal 2009 and 29% in fiscal 2008.
We anticipate that in the future we may start to sell our products directly to some customers located outside of
Canada, the United States and Australia, in which case we would become subject to taxation based on the foreign
statutory rates in the countries where these sales take place and our effective tax rate could fluctuate accordingly.
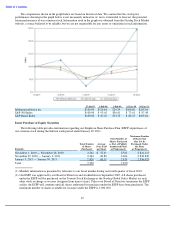
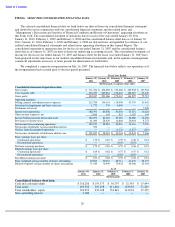
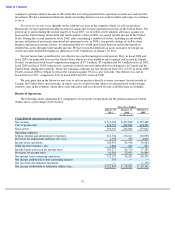
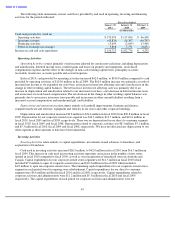
Results of Operations
The following tables summarize key components of our results of operations for the periods indicated, both in
dollars and as a percentage of net revenue:
33
Fiscal Year Ended
January 30,
January 31,
February 1,
2011
2010
2009
(In thousands)
Consolidated statements of operations:
Net revenue
$
711,704
$
452,898
$
353,488
Cost of goods sold
316,757
229,812
174,421
Gross profit
394,947
223,086
179,067
Operating expenses:
Selling, general and administrative expenses
212,784
136,161
118,098
Provision for impairment and lease exit costs
1,772
379
4,405
Income from operations
180,391
86,546
56,564
Other income (expense), net
2,886
164
821
Income before provision for income taxes
183,277
86,710
57,385
Provision for income taxes
61,080
28,429
16,884
Net income from continuing operations
122,197
58,281
40,501
Net income attributable to non
-
controlling interest
350
—
—
Net loss from discontinued operations
—
—
(
1,138
)
Net income attributable to lululemon athletica inc.
$
121,847
$
58,281
$
39,363