Lululemon 2010 Annual Report Download - page 41
Download and view the complete annual report
Please find page 41 of the 2010 Lululemon annual report below. You can navigate through the pages in the report by either clicking on the pages listed below, or by using the keyword search tool below to find specific information within the annual report.-
 1
1 -
2
-
3
-
4
-
5
-
6
-
7
-
8
-
9
-
10
-
11
-
12
-
13
-
14
-
15
-
16
-
17
-
18
-
19
-
20
-
21
-
22
-
23
-
24
-
25
-
26
-
27
-
28
-
29
-
30
-
 31
31 -
 32
32 -
 33
33 -
 34
34 -
 35
35 -
 36
36 -
 37
37 -
 38
38 -
 39
39 -
 40
40 -
 41
41 -
 42
42 -
 43
43 -
 44
44 -
 45
45 -
 46
46 -
 47
47 -
 48
48 -
 49
49 -
 50
50 -
 51
51 -
52
-
53
-
54
-
55
-
56
-
57
-
58
-
59
-
60
-
61
-
62
-
63
-
64
-
65
-
66
-
67
-
68
-
69
-
70
-
71
-
72
-
73
-
74
-
75
-
76
-
77
-
78
-
79
-
80
-
81
-
82
-
83
-
84
-
85
-
86
-
87
-
88
-
89
-
90
-
91
-
92
-
93
-
94
-
95
-
96
-
97
-
98
-
99
-
100
-
101
-
102
-
103
-
104
-
105
-
106
-
107
-
108
-
109
-
110
-
111
-
112
-
113
-
114
-
115
-
116
-
117
-
118
-
119
-
120
-
121
-
122
-
123
-
124
-
125
-
126
-
127
-
128
-
129
-
130
-
131
-
132
-
133
-
134
-
135
-
136
-
137
 |
 |

Table of Contents
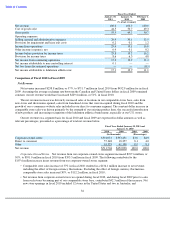
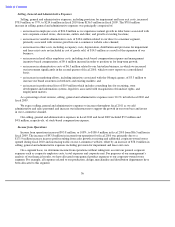
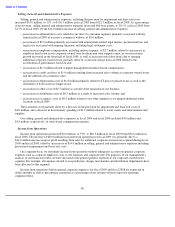
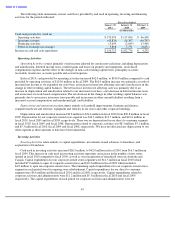
Selling, General and Administrative Expenses
Selling, general and administrative expenses, including provision for impairment and lease exit costs, increased
$78.0 million, or 57%, to $214.6 million in fiscal 2010 from $136.5 million in fiscal 2009. The $78.0 million
increase in selling, general and administrative expenses was principally comprised of:
As a percentage of net revenue, selling, general and administrative expenses were 30.1% in both fiscal 2010 and
fiscal 2009.
We expect selling, general and administrative expenses to increase throughout fiscal 2011 as we add
administrative and sales personnel and increase our infrastructure to support the growth in our store base and invest
in our e-commerce channel.
Our selling, general and administrative expenses in fiscal 2010 and fiscal 2009 included $5.9 million and
$4.8 million, respectively, of stock-based compensation expense.
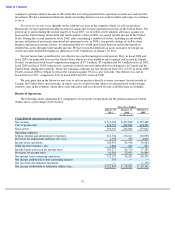
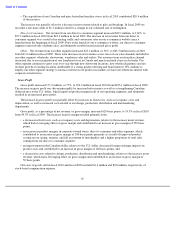
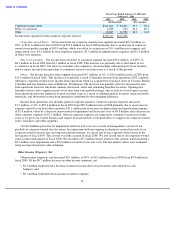
Income from Operations
Income from operations increased $93.8 million, or 108%, to $180.4 million in fiscal 2010 from $86.5 million in
fiscal 2009. The increase of $93.8 million in income from operations for fiscal 2010 was primarily due to a
$171.9 million increase in gross profit resulting from sales growth at existing and additional corporate-owned stores
opened during fiscal 2010 and increasing traffic on our e-commerce
website, offset by an increase of $78.0 million in
selling, general and administrative expenses including provision for impairment and lease exit costs.
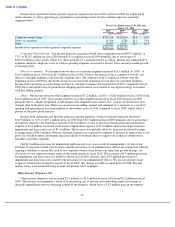
On a segment basis, we determine income from operations without taking into account our general corporate
expenses such as corporate employee costs, travel expenses and corporate rent. For purposes of our management’s
analysis of our financial results, we have allocated some general product expenses to our corporate-owned stores
segment. For example, all expenses related to our production, design, merchandise and distribution departments have
been allocated to this segment.
36
• an increase in employee costs of $24.8 million as we experience natural growth in labor hours associated with
new corporate
-
owned stores, showrooms, outlets and other, and growth at existing locations;
• an increase in variable administrative costs of $18.4 million related to our direct to consumer segment,
primarily associated with revenue growth in our
e
-
commerce
website sales channel;
• an increase in other costs, including occupancy costs, depreciation, distribution and provision for impairment
and lease exist costs not included in cost of goods sold, of $14.5 million as a result of the expansion of our
business;
• an increase in head office employee costs, including stock-based compensation expense and management
incentive
-
based compensation, of $9.6 million incurred in order to position us for long
-
term growth;
• an increase in administrative costs of $6.5 million related to our Australian business, in which we increased
our investment significantly in the second quarter of fiscal 2010, which we now report on a consolidated
basis;
• an increase in marketing efforts, including initiatives associated with the Olympic games, of $3.3 million to
increase our brand awareness in both new and existing markets; and
• an increase in professional fees of $0.9 million which includes consulting fees for recruiting, store
development and information systems, legal fees associated with reacquisition of franchise rights, and
employment matters.