Lululemon 2010 Annual Report Download - page 47
Download and view the complete annual report
Please find page 47 of the 2010 Lululemon annual report below. You can navigate through the pages in the report by either clicking on the pages listed below, or by using the keyword search tool below to find specific information within the annual report.-
 1
1 -
2
-
3
-
4
-
5
-
6
-
7
-
8
-
9
-
10
-
11
-
12
-
13
-
14
-
15
-
16
-
17
-
18
-
19
-
20
-
21
-
22
-
23
-
24
-
25
-
26
-
27
-
28
-
29
-
30
-
31
-
32
-
33
-
34
-
35
-
36
-
 37
37 -
 38
38 -
 39
39 -
 40
40 -
 41
41 -
 42
42 -
 43
43 -
 44
44 -
 45
45 -
 46
46 -
 47
47 -
 48
48 -
 49
49 -
 50
50 -
 51
51 -
 52
52 -
 53
53 -
 54
54 -
 55
55 -
 56
56 -
 57
57 -
58
-
59
-
60
-
61
-
62
-
63
-
64
-
65
-
66
-
67
-
68
-
69
-
70
-
71
-
72
-
73
-
74
-
75
-
76
-
77
-
78
-
79
-
80
-
81
-
82
-
83
-
84
-
85
-
86
-
87
-
88
-
89
-
90
-
91
-
92
-
93
-
94
-
95
-
96
-
97
-
98
-
99
-
100
-
101
-
102
-
103
-
104
-
105
-
106
-
107
-
108
-
109
-
110
-
111
-
112
-
113
-
114
-
115
-
116
-
117
-
118
-
119
-
120
-
121
-
122
-
123
-
124
-
125
-
126
-
127
-
128
-
129
-
130
-
131
-
132
-
133
-
134
-
135
-
136
-
137
 |
 |

Table of Contents
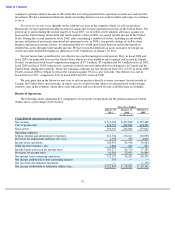
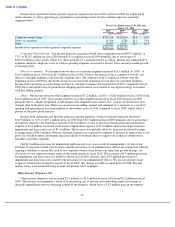
Provision for Income Taxes
Provision for income taxes increased $11.5 million, or 68%, to $28.4 million in fiscal 2009 from $16.9 million
in fiscal 2008. In fiscal 2009, our effective tax rate was 32.8% compared to 29.4% in fiscal 2008. The lower effective
tax rate in fiscal 2008 was due to the release of the valuation allowance against U.S. loss carry forwards in fiscal
2008. We generated taxable income in the United States in fiscal 2009 which contributed to the increase in the
effective tax rate.
During fiscal 2009 an adjustment was made to deferred tax assets and additional paid-
in capital in the amount of
$4,963 relating to windfall recorded in the year ended February 1, 2009 in excess of taxes payable. We concluded
that the adjustment was not material to the financial statements.
Net Income
Net income increased $18.9 million, or 48%, to $58.3 million in fiscal 2009 from $39.4 million in fiscal 2008.
The increase in net income of $18.9 million in fiscal 2009 was a result of an increase in gross profit of $44.0 million
increase in gross profit resulting from sales by additional corporate-owned stores opened during fiscal 2009 and
fiscal 2008, offset by an increase of $14.0 million in selling, general and administrative expenses including provision
for impairment and lease exit costs, an increase of $11.5 million in provision for income taxes and a decrease of
$0.7 million in other income (expense), net.
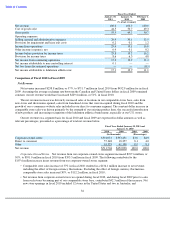
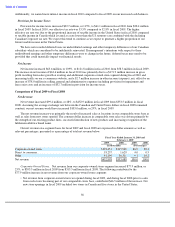
Seasonality
In fiscal 2010, fiscal 2009, and fiscal 2008, we recognized a significant amount of our net revenue in the fourth
quarter due to significant increases in sales during the holiday season. We recognized 36%, 39%, and 29% of our full
year gross profit in the fourth quarter in fiscal 2010, fiscal 2009 and fiscal 2008, respectively. Despite the fact that we
have experienced a significant amount of our net revenue and gross profit in the fourth quarter of our fiscal year, we
believe that the true extent of the seasonality or cyclical nature of our business may have been overshadowed by our
rapid growth to date. As our expected growth rate slows, we believe that we will experience fourth quarter gross
profits as a percentage of full year gross profits as high, or higher, than in the current year.
The level of our working capital reflects the seasonality of our business. We expect inventory, accounts payable
and accrued expenses to be higher in the third and fourth quarters in preparation for the holiday selling season.
Because our products are sold primarily through our stores, order backlog is not material to our business.
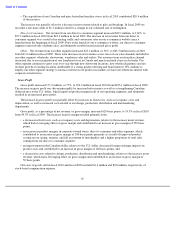
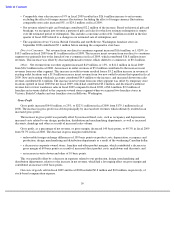
Liquidity and Capital Resources
Our primary sources of liquidity are our current balances of cash and cash equivalents, cash flows from
operations and borrowings available under our revolving credit facility. Our primary cash needs are capital
expenditures for opening new stores and remodeling existing stores, making information technology system
enhancements and funding working capital requirements. Cash and cash equivalents in excess of our needs are held
in interest bearing accounts with financial institutions.
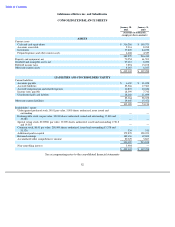
As of January 30, 2011, our working capital (excluding cash and cash equivalents) was a deficit of $12.4 million
and our cash and cash equivalents were $316.3 million.
42