Lululemon 2010 Annual Report Download - page 40
Download and view the complete annual report
Please find page 40 of the 2010 Lululemon annual report below. You can navigate through the pages in the report by either clicking on the pages listed below, or by using the keyword search tool below to find specific information within the annual report.-
 1
1 -
2
-
3
-
4
-
5
-
6
-
7
-
8
-
9
-
10
-
11
-
12
-
13
-
14
-
15
-
16
-
17
-
18
-
19
-
20
-
21
-
22
-
23
-
24
-
25
-
26
-
27
-
28
-
29
-
 30
30 -
 31
31 -
 32
32 -
 33
33 -
 34
34 -
 35
35 -
 36
36 -
 37
37 -
 38
38 -
 39
39 -
 40
40 -
 41
41 -
 42
42 -
 43
43 -
 44
44 -
 45
45 -
 46
46 -
 47
47 -
 48
48 -
 49
49 -
 50
50 -
51
-
52
-
53
-
54
-
55
-
56
-
57
-
58
-
59
-
60
-
61
-
62
-
63
-
64
-
65
-
66
-
67
-
68
-
69
-
70
-
71
-
72
-
73
-
74
-
75
-
76
-
77
-
78
-
79
-
80
-
81
-
82
-
83
-
84
-
85
-
86
-
87
-
88
-
89
-
90
-
91
-
92
-
93
-
94
-
95
-
96
-
97
-
98
-
99
-
100
-
101
-
102
-
103
-
104
-
105
-
106
-
107
-
108
-
109
-
110
-
111
-
112
-
113
-
114
-
115
-
116
-
117
-
118
-
119
-
120
-
121
-
122
-
123
-
124
-
125
-
126
-
127
-
128
-
129
-
130
-
131
-
132
-
133
-
134
-
135
-
136
-
137
 |
 |

Table of Contents
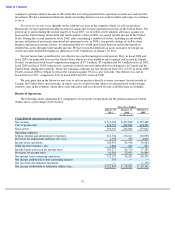
The increase was partially offset by a decrease in net revenue related to gift card breakage. In fiscal 2009 we
recorded a one-time credit of $1.3 million related to a change in our estimated rate of redemption.
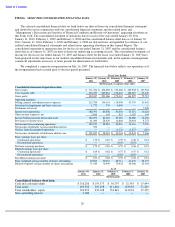
Direct to Consumer. Net revenue from our direct to consumer segment increased $39.1 million, or 214%, to
$57.3 million in fiscal 2010 from $18.3 million in fiscal 2009. The increase in net revenue from our direct to
consumer segment was a result of increasing traffic and conversion rates on our e-commerce website since it
launched near the beginning of fiscal 2009. Prior to the launch of our e-commerce website, our direct to consumer
segment consisted only of phone sales, and ultimately resulted in an increased gross profit.
Other. Net revenue from our other segment increased $22.1 million, or 54%, to $63.3 million in fiscal 2010
from $41.2 million in fiscal 2009. There were increases in net revenues across most of our sales channels included in
our other segment: wholesale, showrooms, warehouse sales and outlets. Net revenues from our franchise channel
decreased due to our reacquisition of one franchised store in Canada and nine franchised stores in Australia. Our
other segment continues to grow year over year through new showroom locations, new wholesale partners and net
revenue growth at existing locations attributable to a strong product offering and brand interest. We continue to
employ our other segment strategy to increase interest in our product in markets we have not otherwise entered with
corporate-owned stores.
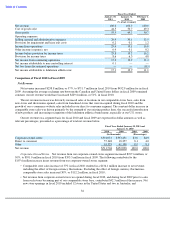
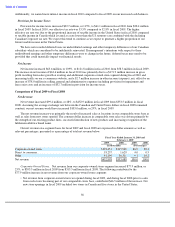
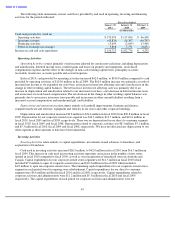
Gross Profit
Gross profit increased 171.9 million, or 77%, to 394.9 million in fiscal 2010 from $223.1 million in fiscal 2009.
The increase in gross profit was driven principally by increased net revenues as well as a strengthening Canadian
dollar relative to the U.S. dollar, which improved product margin in all of our operating segments, and ultimately
resulted in an increased gross profit.
The increase in gross profit was partially offset by increases in fixed costs, such as occupancy costs and
depreciation, as well as increased costs related to our design, production, distribution and merchandising
departments.
Gross profit, as a percentage of net revenue, or gross margin, increased 620 basis points, to 55.5% in fiscal 2010
from 49.3% in fiscal 2009. The increase in gross margin resulted primarily from:
Our costs of goods sold in fiscal 2010 and fiscal 2009 included $1.4 million and $0.8 million, respectively, of
stock-based compensation expense.
35
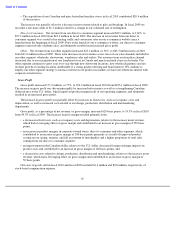
• The acquisition of one Canadian and nine Australian franchise stores in fiscal 2010 contributed $20.4 million
of the increase.
• a decrease in fixed costs, such as occupancy costs and depreciation, relative to the increase in net revenue,
which had a leveraging effect on gross margin and contributed to an increase in gross margin of 250 basis
points;
• an increase in product margins in corporate-owned stores, direct to consumer and other segments, which
contributed to an increase in gross margin of 180 basis points primarily as a result of improved product
costing on our spring, summer, and fall assortment of merchandise and a higher proportion of total sales
coming from our direct to consumer segment;
• an improvement in the Canadian dollar, relative to the U.S. dollar, decreased foreign exchange impacts on
product costs and contributed to an increase in gross margin of 140 basis points; and
•
a decrease in costs related to design, production, distribution and merchandising, relative to the increase in net
revenue, which had a leveraging effect on gross margin and contributed to an increase in gross margin of
50 basis points.