Lululemon 2010 Annual Report Download - page 43
Download and view the complete annual report
Please find page 43 of the 2010 Lululemon annual report below. You can navigate through the pages in the report by either clicking on the pages listed below, or by using the keyword search tool below to find specific information within the annual report.-
 1
1 -
2
-
3
-
4
-
5
-
6
-
7
-
8
-
9
-
10
-
11
-
12
-
13
-
14
-
15
-
16
-
17
-
18
-
19
-
20
-
21
-
22
-
23
-
24
-
25
-
26
-
27
-
28
-
29
-
30
-
31
-
32
-
 33
33 -
 34
34 -
 35
35 -
 36
36 -
 37
37 -
 38
38 -
 39
39 -
 40
40 -
 41
41 -
 42
42 -
 43
43 -
 44
44 -
 45
45 -
 46
46 -
 47
47 -
 48
48 -
 49
49 -
 50
50 -
 51
51 -
 52
52 -
 53
53 -
54
-
55
-
56
-
57
-
58
-
59
-
60
-
61
-
62
-
63
-
64
-
65
-
66
-
67
-
68
-
69
-
70
-
71
-
72
-
73
-
74
-
75
-
76
-
77
-
78
-
79
-
80
-
81
-
82
-
83
-
84
-
85
-
86
-
87
-
88
-
89
-
90
-
91
-
92
-
93
-
94
-
95
-
96
-
97
-
98
-
99
-
100
-
101
-
102
-
103
-
104
-
105
-
106
-
107
-
108
-
109
-
110
-
111
-
112
-
113
-
114
-
115
-
116
-
117
-
118
-
119
-
120
-
121
-
122
-
123
-
124
-
125
-
126
-
127
-
128
-
129
-
130
-
131
-
132
-
133
-
134
-
135
-
136
-
137
 |
 |

Table of Contents
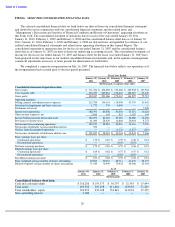
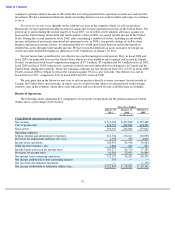
Additionally, we earned more interest income in fiscal 2010 compared to fiscal 2009 on our increased cash balances.
Provision for Income Taxes
Provision for income taxes increased $32.7 million, or 115%, to $61.1 million in fiscal 2010 from $28.4 million
in fiscal 2009. In fiscal 2010, our effective tax rate was 33.3% compared to 32.8% in fiscal 2009. The higher
effective tax rate was due to the proportional increase of taxable income in the United States in fiscal 2010 compared
to taxable income in Canada which is taxed at a rate lower than the US statutory rate combined with the declining
Canadian Corporate tax rate. We expect this trend to continue as we expect to generate a higher proportion of our
future taxable income in the United States.
We have not recorded deferred taxes on undistributed earnings and other temporary differences of our Canadian
subsidiary which are considered to be indefinitely reinvested. If management’s intentions with respect to these
undistributed earnings and other temporary differences were to change in the future, deferred taxes may need to be
provided that could materially impact our financial results.
Net Income
Net income increased $63.6 million, or 109%, to $121.8 million in fiscal 2010 from $58.3 million in fiscal 2009.
The increase in net income of $63.6 million in fiscal 2010 was primarily due to a $171.9 million increase in gross
profit resulting from sales growth at existing and additional corporate-owned stores opened during fiscal 2010 and
increasing traffic on our e-commerce
website, and a $2.7 million increase in other income (expense), net, offset by an
increase of $78.0 million in selling, general and administrative expenses including provision for impairment and
lease exist costs and an increase of $32.7 million in provision for income taxes.
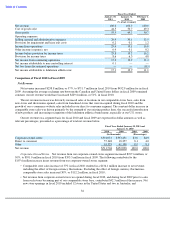
Comparison of Fiscal 2009 to Fiscal 2008
Net Revenue
Net revenue increased $99.4 million, or 28%, to $452.9 million in fiscal 2009 from $353.5 million in fiscal
2008. Assuming the average exchange rate between the Canadian and United States dollars in fiscal 2008 remained
constant, our net revenue would have increased $103.0 million, or 29%, in fiscal 2009.
The net revenue increase was primarily the result of increased sales at locations in our comparable stores base as
well as sales from new stores opened. The constant dollar increase in comparable store sales was driven primarily by
the strength of our existing product lines, successful introduction of new products and increasing recognition of the
lululemon athletica brand name.
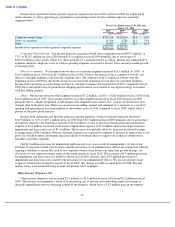
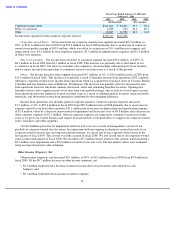
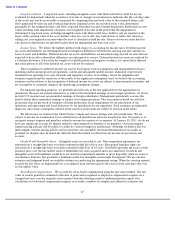
Our net revenue on a segment basis for fiscal 2009 and fiscal 2008 are expressed in dollar amounts as well as
relevant percentages, presented as a percentage of total net revenue below.
Corporate-Owned Stores. Net revenue from our corporate-owned stores segment increased $77.9 million, or
25%, to $393.5 million in fiscal 2009 from $315.5 million in fiscal 2008. The following contributed to the
$77.9 million increase in net revenue from our corporate-owned stores segment:
38
Fiscal Year Ended January 31, 2010 and
February 1, 2009
2009
2008
2009
2008
(In thousands)
(Percentages)
Corporate
-
owned stores
$
393,451
$
315,548
86.9
89.3
Direct to consumer
18,257
1,629
4.0
0.5
Other
41,190
36,311
9.1
10.2
Net revenue
$
452,898
$
353,488
100.0
100.0
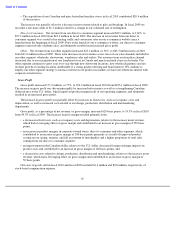
•
Net revenue from corporate
-owned stores we opened during fiscal 2009, and during fiscal 2008 prior to sales
from such stores becoming part of our comparable stores base, contributed $46.5 million of the increase. Net
new store openings in fiscal 2009 included two stores in Canada and five stores in the United States;