Lululemon 2010 Annual Report Download - page 60
Download and view the complete annual report
Please find page 60 of the 2010 Lululemon annual report below. You can navigate through the pages in the report by either clicking on the pages listed below, or by using the keyword search tool below to find specific information within the annual report.-
 1
1 -
2
-
3
-
4
-
5
-
6
-
7
-
8
-
9
-
10
-
11
-
12
-
13
-
14
-
15
-
16
-
17
-
18
-
19
-
20
-
21
-
22
-
23
-
24
-
25
-
26
-
27
-
28
-
29
-
30
-
31
-
32
-
33
-
34
-
35
-
36
-
37
-
38
-
39
-
40
-
41
-
42
-
43
-
44
-
45
-
46
-
47
-
48
-
49
-
 50
50 -
 51
51 -
 52
52 -
 53
53 -
 54
54 -
 55
55 -
 56
56 -
 57
57 -
 58
58 -
 59
59 -
 60
60 -
 61
61 -
 62
62 -
 63
63 -
 64
64 -
 65
65 -
 66
66 -
 67
67 -
 68
68 -
 69
69 -
 70
70 -
71
-
72
-
73
-
74
-
75
-
76
-
77
-
78
-
79
-
80
-
81
-
82
-
83
-
84
-
85
-
86
-
87
-
88
-
89
-
90
-
91
-
92
-
93
-
94
-
95
-
96
-
97
-
98
-
99
-
100
-
101
-
102
-
103
-
104
-
105
-
106
-
107
-
108
-
109
-
110
-
111
-
112
-
113
-
114
-
115
-
116
-
117
-
118
-
119
-
120
-
121
-
122
-
123
-
124
-
125
-
126
-
127
-
128
-
129
-
130
-
131
-
132
-
133
-
134
-
135
-
136
-
137
 |
 |
Table of Contents
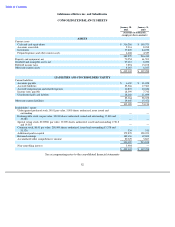
lululemon athletica inc. and Subsidiaries
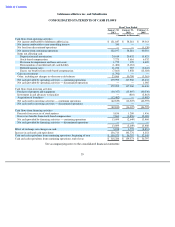
CONSOLIDATED STATEMENTS OF CASH FLOWS
See accompanying notes to the consolidated financial statements
55
Fiscal Year Ended
January 30,
January 31,
February 1,
2011
2010
2009
(Amounts in thousands)
Cash flows from operating activities
Net income attributable to lululemon athletica inc.
$
121,847
$
58,281
$
39,363
Net income attributable to
non
-
controlling
interest
350
—
—
Net loss from discontinued operations
—
—
(
1,138
)
Net income from continuing operations
122,197
58,281
40,501
Items not affecting cash
Depreciation and amortization
24,614
20,832
15,823
Stock
-
based compensation
7,273
5,616
6,532
Provision for impairment and lease exit costs
1,772
379
4,405
Derecognition of unredeemed gift card liability
(1,406
)
(2,183
)
—
Deferred income taxes
11,234
387
(6,441
)
Excess tax benefits from stock
-
based compensation
(7,863
)
3,858
(12,024
)
Gain on investment
(1,792
)
—
—
Other, including net changes in other non
-
cash balances
23,966
30,790
(3,363
)
Net cash provided by operating activities
—
continuing operations
179,995
117,960
45,433
Net cash provided by operating activities
—
discontinued operations
—
—
1,005
179,995
117,960
46,438
Cash flows from investing activities
Purchase of property and equipment
(30,357
)
(15,497
)
(40,530
)
Investment in and advances to franchise
—
(
810
)
(2,863
)
Acquisition of franchises
(12,482
)
—
(
3,402
)
Net cash used in investing activities
—
continuing operations
(42,839
)
(16,307
)
(46,795
)
Net cash used in investing activities
—
discontinued operations
—
—
—
(42,839
)
(16,307
)
(46,795
)
Cash flows from financing activities
Proceeds from exercise of stock options
5,836
1,209
1,436
Excess tax benefits from stock
-
based compensation
7,863
(3,858
)
12,024
Net cash provided by financing activities
—
continuing operations
13,699
(2,649
)
13,460
Net cash provided by financing activities
—
discontinued operations
—
—
—
13,699
(2,649
)
13,460
Effect of exchange rate changes on cash
5,858
3,772
(8,851
)
Increase in cash and cash equivalents
156,713
102,776
4,252
Cash and cash equivalents from continuing operations, beginning of year
$
159,573
$
56,797
$
52,545
Cash and cash equivalents from continuing operations, end of year
$
316,286
$
159,573
$
56,797