Lululemon 2010 Annual Report Download - page 39
Download and view the complete annual report
Please find page 39 of the 2010 Lululemon annual report below. You can navigate through the pages in the report by either clicking on the pages listed below, or by using the keyword search tool below to find specific information within the annual report.-
 1
1 -
2
-
3
-
4
-
5
-
6
-
7
-
8
-
9
-
10
-
11
-
12
-
13
-
14
-
15
-
16
-
17
-
18
-
19
-
20
-
21
-
22
-
23
-
24
-
25
-
26
-
27
-
28
-
 29
29 -
 30
30 -
 31
31 -
 32
32 -
 33
33 -
 34
34 -
 35
35 -
 36
36 -
 37
37 -
 38
38 -
 39
39 -
 40
40 -
 41
41 -
 42
42 -
 43
43 -
 44
44 -
 45
45 -
 46
46 -
 47
47 -
 48
48 -
 49
49 -
50
-
51
-
52
-
53
-
54
-
55
-
56
-
57
-
58
-
59
-
60
-
61
-
62
-
63
-
64
-
65
-
66
-
67
-
68
-
69
-
70
-
71
-
72
-
73
-
74
-
75
-
76
-
77
-
78
-
79
-
80
-
81
-
82
-
83
-
84
-
85
-
86
-
87
-
88
-
89
-
90
-
91
-
92
-
93
-
94
-
95
-
96
-
97
-
98
-
99
-
100
-
101
-
102
-
103
-
104
-
105
-
106
-
107
-
108
-
109
-
110
-
111
-
112
-
113
-
114
-
115
-
116
-
117
-
118
-
119
-
120
-
121
-
122
-
123
-
124
-
125
-
126
-
127
-
128
-
129
-
130
-
131
-
132
-
133
-
134
-
135
-
136
-
137
 |
 |

Table of Contents
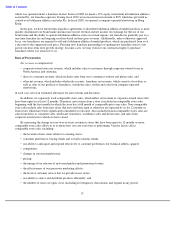
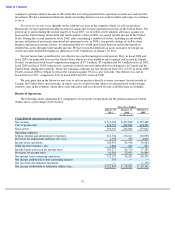
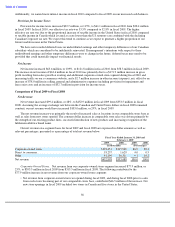
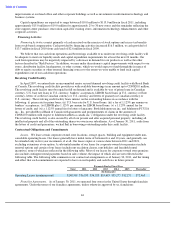
Comparison of Fiscal 2010 to Fiscal 2009
Net Revenue
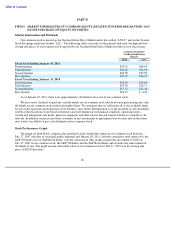
Net revenue increased $258.8 million, or 57%, to $711.7 million in fiscal 2010 from $452.9 million for in fiscal
2009. Assuming the average exchange rate between the Canadian and United States dollars in fiscal 2009 remained
constant, our net revenue would have increased $229.6 million, or 51%, in fiscal 2010.
The net revenue increase was driven by increased sales at locations in our comparable stores base, sales from
new stores and showrooms opened, sales from franchised stores that were reacquired during fiscal 2010 and the
growth of our e-commerce website sales included in our direct to consumer segment. The constant dollar increase in
comparable store sales was driven primarily by the strength of our existing product lines, the successful introduction
of new products and increasing recognition of the lululemon athletica brand name, especially at our U.S. stores.
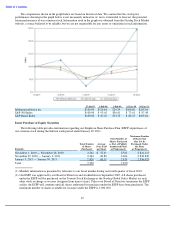
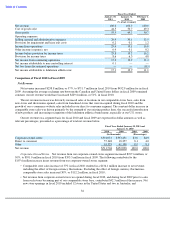
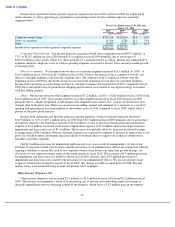
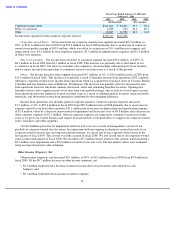
Our net revenue on a segment basis for fiscal 2010 and fiscal 2009 are expressed in dollar amounts as well as
relevant percentages, presented as a percentage of total net revenue below.
Corporate-Owned Stores. Net revenue from our corporate-owned stores segment increased $197.6 million, or
50%, to $591.0 million in fiscal 2010 from $393.5 million in fiscal 2009. The following contributed to the
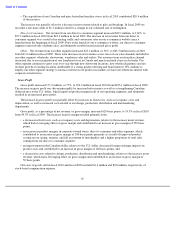
$197.6 million increase in net revenue from our corporate-owned stores segment:
34
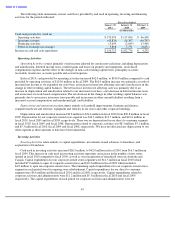
Fiscal Year Ended
January 30,
January 31,
February 1,
2011
2010
2009
(% of net revenue)}
Net revenue
100.0
100.0
100.0
Cost of goods sold
44.5
50.7
49.3
Gross profit
55.5
49.3
50.7
Operating expenses:
Selling, general and administrative expenses
29.9
30.1
33.5
Provision for impairment and lease exit costs
0.2
0.1
1.2
Income from operations
25.4
19.1
16.0
Other income (expense), net
0.4
0.1
0.2
Income before provision for income taxes
25.8
19.2
16.2
Provision for income taxes
8.6
6.3
4.8
Net income from continuing operations
17.2
12.9
11.4
Net income attributable to non
-
controlling interest
0.1
—
—
Net loss from discontinued operations
—
—
(
0.3
)
Net income attributable to lululemon athletica inc
17.1
12.9
11.1
Fiscal Year Ended January 30, 2011 and
January 31, 2010
2010
2009
2010
2009
(In thousands)
(Percentages)
Corporate
-
owned stores
$
591,031
$
393,451
83.0
86.9
Direct to consumer
57,348
18,257
8.1
4.0
Other
63,325
41,190
8.9
9.1
Net revenue
$
711,704
$
452,898
100.0
100.0
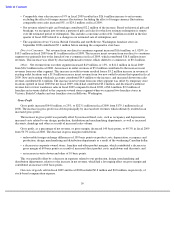
• Comparable store sales increase of 37% in fiscal 2010 resulted in a $136.1 million increase to net revenue,
including the effect of foreign currency fluctuations. Excluding the effect of foreign currency fluctuations,
comparable store sales increased 30%, or $112.2 million, in fiscal 2010;
•
Net revenue from corporate
-owned stores we opened during fiscal 2010, and during fiscal 2009 prior to sales
from such stores becoming part of our comparable stores base, contributed $42.3 million of the increase. Net
new store openings in fiscal 2010 included 12 stores in the United States and two in Australia; and