Lululemon 2010 Annual Report Download - page 33
Download and view the complete annual report
Please find page 33 of the 2010 Lululemon annual report below. You can navigate through the pages in the report by either clicking on the pages listed below, or by using the keyword search tool below to find specific information within the annual report.-
 1
1 -
2
-
3
-
4
-
5
-
6
-
7
-
8
-
9
-
10
-
11
-
12
-
13
-
14
-
15
-
16
-
17
-
18
-
19
-
20
-
21
-
22
-
 23
23 -
 24
24 -
 25
25 -
 26
26 -
 27
27 -
 28
28 -
 29
29 -
 30
30 -
 31
31 -
 32
32 -
 33
33 -
 34
34 -
 35
35 -
 36
36 -
 37
37 -
 38
38 -
 39
39 -
 40
40 -
 41
41 -
 42
42 -
 43
43 -
44
-
45
-
46
-
47
-
48
-
49
-
50
-
51
-
52
-
53
-
54
-
55
-
56
-
57
-
58
-
59
-
60
-
61
-
62
-
63
-
64
-
65
-
66
-
67
-
68
-
69
-
70
-
71
-
72
-
73
-
74
-
75
-
76
-
77
-
78
-
79
-
80
-
81
-
82
-
83
-
84
-
85
-
86
-
87
-
88
-
89
-
90
-
91
-
92
-
93
-
94
-
95
-
96
-
97
-
98
-
99
-
100
-
101
-
102
-
103
-
104
-
105
-
106
-
107
-
108
-
109
-
110
-
111
-
112
-
113
-
114
-
115
-
116
-
117
-
118
-
119
-
120
-
121
-
122
-
123
-
124
-
125
-
126
-
127
-
128
-
129
-
130
-
131
-
132
-
133
-
134
-
135
-
136
-
137
 |
 |

Table of Contents
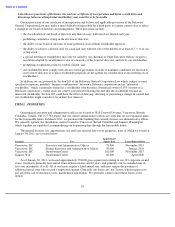
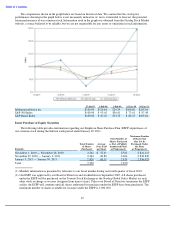
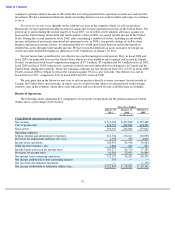
The selected consolidated financial data set forth below are derived from our consolidated financial statements
and should be read in conjunction with our consolidated financial statements and the related notes and
“Management’s Discussion and Analysis of Financial Condition and Results of Operations” appearing elsewhere in
this Form 10-K. The consolidated statement of operations data for each of the years ended January 30, 2011,
January 31, 2010, February 1, 2009 and February 3, 2008 and the consolidated balance sheet data as of January 30,
2011, January 31, 2010, February 1, 2009 and February 3, 2008 are derived from, and qualified by reference to, our
audited consolidated financial statements and related notes appearing elsewhere in this Annual Report. The
consolidated statement of operations data for the fiscal year ended January 31, 2007 and the consolidated balance
sheet data as of January 31, 2007 are derived from our underlying accounting records. The consolidated statements of
income for the fiscal year ended January 31, 2007 and balance sheet for the fiscal year ended January 31, 2007 have
been prepared on the same basis as our audited consolidated financial statements and, in the opinion of management,
contain all adjustments necessary to fairly present the information set forth below.
We completed a corporate reorganization on July 26, 2007. The financial data below reflects our operations as if
the reorganization had occurred prior to the first period presented.
28
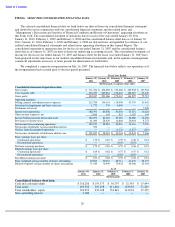
ITEM 6.
SELECTED CONSOLIDATED FINANCIAL DATA
Fiscal Year Ended
January 30,
January 31,
February 1,
February 3,
January 31,
2011
2010
2009
2008
2007
(In thousands, except per share data)
Consolidated statement of operations data:
Net revenue
$
711,704
$
452,898
$
353,488
$
269,942
$
147,964
Cost of goods sold
316,757
229,812
174,421
125,015
72,249
Gross profit
394,947
223,086
179,067
144,927
75,715
Operating expenses:
Selling, general and administrative expenses
212,784
136,161
118,098
93,376
51,863
Provision for impairment and lease exit costs
1,772
379
4,405
—
—
Settlement of lawsuit
—
—
—
—
7,228
Income from operations
180,391
86,546
56,564
51,551
16,624
Other income (expense), net
2,886
164
821
1,029
104
Income before provision for income taxes
183,277
86,710
57,385
52,580
16,728
Provision for income taxes
61,080
28,429
16,884
20,464
8,752
Net income from continuing operations
122,197
58,281
40,501
32,116
7,976
Net income attributable to non
-
controlling interest
350
—
—
—
—
Net loss from discontinued operations
—
—
(
1,138
)
(1,273
)
(310
)
Net income attributable to lululemon athletica inc.
$
121,847
$
58,281
$
39,363
$
30,843
$
7,666
Basic earnings (loss) per share
Continuing operations
$
1.72
$
0.83
$
0.59
$
0.48
$
0.12
Discontinued operations
—
—
(
0.02
)
(0.02
)
—
Net basic earnings per share
$
1.72
$
0.83
$
0.57
$
0.46
$
0.12
Diluted earnings (loss) per share
Continuing operations
$
1.69
$
0.82
$
0.57
$
0.47
$
0.12
Discontinued operations
—
—
(
0.02
)
(0.02
)
—
Net diluted earnings per share
$
1.69
$
0.82
$
0.55
$
0.45
$
0.12
Basic weighted
-
average number of shares outstanding
70,860
70,251
68,711
66,430
65,157
Diluted weighted
-
average number of shares outstanding
71,929
70,949
70,942
69,298
65,304
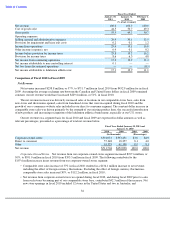
As of
January 30,
January 31,
February 1,
February 3,
January 31,
2011
2010
2009
2008
2007
(In thousands)
Consolidated balance sheet data:
Cash and cash equivalents
$
316,286
$
159,573
$
56,797
$
52,545
$
15,494
Total assets
499,302
307,258
211,636
155,092
71,325
Total stockholders
’
equity
394,293
233,108
154,843
112,034
37,379
Non
-
controlling interest
3,904
—
—
—
—