Lululemon 2010 Annual Report Download - page 45
Download and view the complete annual report
Please find page 45 of the 2010 Lululemon annual report below. You can navigate through the pages in the report by either clicking on the pages listed below, or by using the keyword search tool below to find specific information within the annual report.-
 1
1 -
2
-
3
-
4
-
5
-
6
-
7
-
8
-
9
-
10
-
11
-
12
-
13
-
14
-
15
-
16
-
17
-
18
-
19
-
20
-
21
-
22
-
23
-
24
-
25
-
26
-
27
-
28
-
29
-
30
-
31
-
32
-
33
-
34
-
 35
35 -
 36
36 -
 37
37 -
 38
38 -
 39
39 -
 40
40 -
 41
41 -
 42
42 -
 43
43 -
 44
44 -
 45
45 -
 46
46 -
 47
47 -
 48
48 -
 49
49 -
 50
50 -
 51
51 -
 52
52 -
 53
53 -
 54
54 -
 55
55 -
56
-
57
-
58
-
59
-
60
-
61
-
62
-
63
-
64
-
65
-
66
-
67
-
68
-
69
-
70
-
71
-
72
-
73
-
74
-
75
-
76
-
77
-
78
-
79
-
80
-
81
-
82
-
83
-
84
-
85
-
86
-
87
-
88
-
89
-
90
-
91
-
92
-
93
-
94
-
95
-
96
-
97
-
98
-
99
-
100
-
101
-
102
-
103
-
104
-
105
-
106
-
107
-
108
-
109
-
110
-
111
-
112
-
113
-
114
-
115
-
116
-
117
-
118
-
119
-
120
-
121
-
122
-
123
-
124
-
125
-
126
-
127
-
128
-
129
-
130
-
131
-
132
-
133
-
134
-
135
-
136
-
137
 |
 |

Table of Contents
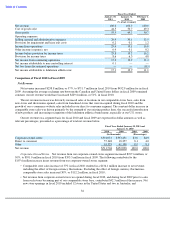
Selling, General and Administrative Expenses
Selling, general and administrative expenses, including the provision for impairment and lease exit costs,
increased $14.0 million, or 11%, to $136.5 million in fiscal 2009 from $122.5 million in fiscal 2008. As a percentage
of net revenue, selling, general and administrative expenses decreased 460 basis points, to 30.1%, in fiscal 2009 from
34.7% in fiscal 2008. Of the $14.0 million increase in selling, general and administrative expenses:
These amounts were partially offset by a decrease in the provision for impairment and lease exit costs of
$4.0 million, and a decrease in discretionary spending of $1.7 million related to travel, meals and entertainment and
supplies.
Our selling, general and administrative expenses in fiscal 2009 and fiscal 2008 included $4.8 million and
$5.8 million, respectively, of stock-based compensation expense.
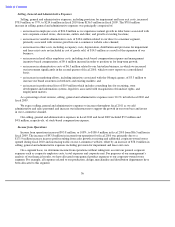
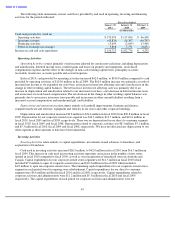
Income from Operations
Income from operations increased $30.0 million, or 53%, to $86.5 million in fiscal 2009 from $56.6 million in
fiscal 2008. The increase of $30.0 million in income from operations for fiscal 2009 was primarily due to a
$44.0 million increase in gross profit resulting from sales by additional corporate-owned stores opened during fiscal
2009 and fiscal 2008, offset by an increase of $14.0 million in selling, general and administrative expenses including
provision for impairment and lease exit costs.
On a segment basis, we determine income from operations without taking into account our general corporate
expenses such as corporate employee costs, travel expenses and corporate rent. For purposes of our management’s
analysis of our financial results, we have allocated some general product expenses to our corporate-owned stores
segment. For example, all expenses related to our production, design, merchandise and distribution departments have
been allocated to this segment.
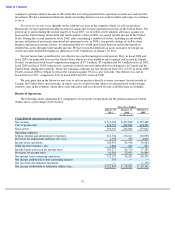
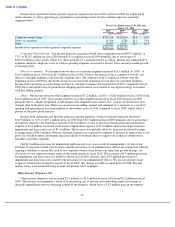
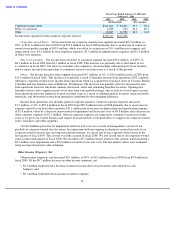
Income from operations (before general corporate expenses) for fiscal 2009 and fiscal 2008 are expressed in
dollar amounts as well as percentages, presented as a percentage of net revenue of their respective operating
segments below.
40
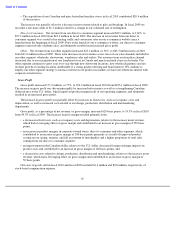
• an increase in administrative costs related to our direct to consumer segment, primarily associated with the
launch in fiscal 2009 of our new
e
-
commerce
website, of $5.6 million;
• an increase of $3.8 million primarily associated with employment-related legal matters, professional fees and
legal costs associated with ongoing litigation, including legal settlement costs;
• an increase in employee compensation, including options expense, of $2.7 million related to an increase in
employee head count in our corporate-owned store locations and store support center, as our net revenue
growth recovered in the latter half of fiscal 2009, as well as increased store labor hours due to opening
additional corporate-owned stores, partially offset by a one-time charge in fiscal 2008 related to the
acceleration of performance
-
based awards;
•
an increase of $2.3 million related to higher management incentive
-
based compensation;
• an increase in credit card fees of $1.9 million resulting from increased sales volume at corporate-
owned stores
and the addition of
e
-
commerce
sales;
• an increase in depreciation costs of $1.8 million primarily related to IT projects placed in use as well as the
retirement of fixed assets no longer in use;
•
an increase in other costs of $0.7 million as a result of the expansion of our business;
•
an increase in distribution costs of $0.5 million as a result of increased sales volume; and
• an increase in occupancy costs of $0.4 million related to our other segment as we opened additional outlet
locations in fiscal 2009.