Lululemon 2010 Annual Report Download - page 42
Download and view the complete annual report
Please find page 42 of the 2010 Lululemon annual report below. You can navigate through the pages in the report by either clicking on the pages listed below, or by using the keyword search tool below to find specific information within the annual report.-
 1
1 -
2
-
3
-
4
-
5
-
6
-
7
-
8
-
9
-
10
-
11
-
12
-
13
-
14
-
15
-
16
-
17
-
18
-
19
-
20
-
21
-
22
-
23
-
24
-
25
-
26
-
27
-
28
-
29
-
30
-
31
-
 32
32 -
 33
33 -
 34
34 -
 35
35 -
 36
36 -
 37
37 -
 38
38 -
 39
39 -
 40
40 -
 41
41 -
 42
42 -
 43
43 -
 44
44 -
 45
45 -
 46
46 -
 47
47 -
 48
48 -
 49
49 -
 50
50 -
 51
51 -
 52
52 -
53
-
54
-
55
-
56
-
57
-
58
-
59
-
60
-
61
-
62
-
63
-
64
-
65
-
66
-
67
-
68
-
69
-
70
-
71
-
72
-
73
-
74
-
75
-
76
-
77
-
78
-
79
-
80
-
81
-
82
-
83
-
84
-
85
-
86
-
87
-
88
-
89
-
90
-
91
-
92
-
93
-
94
-
95
-
96
-
97
-
98
-
99
-
100
-
101
-
102
-
103
-
104
-
105
-
106
-
107
-
108
-
109
-
110
-
111
-
112
-
113
-
114
-
115
-
116
-
117
-
118
-
119
-
120
-
121
-
122
-
123
-
124
-
125
-
126
-
127
-
128
-
129
-
130
-
131
-
132
-
133
-
134
-
135
-
136
-
137
 |
 |

Table of Contents
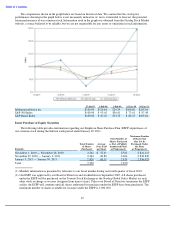
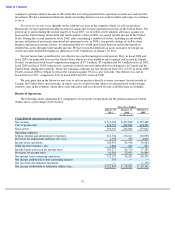
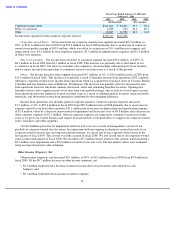
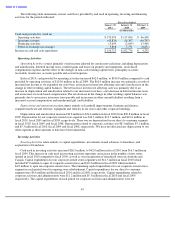
Income from operations (before general corporate expenses) for fiscal 2010 and fiscal 2009 are expressed in
dollar amounts as well as percentages, presented as a percentage of net revenue of their respective operating
segments below.
Corporate-Owned Stores. Net income from our corporate-owned stores segment increased $93.5 million, or
77%, to $215.2 million for fiscal 2010 from $121.6 million for fiscal 2009 primarily due to an increase of
$134.0 million in gross profit, which was offset partially by a natural increase in selling, general and administrative
expenses related to employee costs as well as operating expenses associated with new stores and net revenue growth
at existing stores.
Direct to consumer. Net income from our direct to consumer segment increased $10.1 million, or 160%, to
$16.4 million in fiscal 2010 from $6.3 million in fiscal 2009. Prior to the launch of our e-commerce website, our
direct to consumer segment consisted only of phone sales. The addition of our e-commerce website near the
beginning of fiscal 2009 has driven the increase in income from operations for our direct to consumer segment.
Income from operations as a percentage of direct to consumer revenues decreased in fiscal 2010 compared to fiscal
2009 due to the introduction of promotional shipping and increased costs related to our digital strategy associated
with this selling channel.
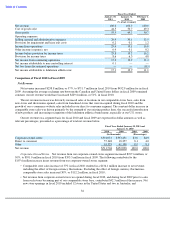
Other.
Net income from our other segment increased $7.2 million, or 66%, to $18.0 million in fiscal 2010 from
$10.8 million in fiscal 2009. Gross profit related to our other segment increased in fiscal 2010 from fiscal 2009
primarily due to a higher proportion of full margin sales channels in the current year, such as our showroom sales
channel, than in the prior year. There was an increase in selling, general and administrative expenses as a result of
opening and operating an increased number of showrooms in fiscal 2010 compared to fiscal 2009, which offset a
portion of the gross profit increase.
Income from operations also includes general corporate expenses. General corporate expenses increased
$16.9 million, or 32%, to $69.1 million in fiscal 2010 from $52.2 million in fiscal 2009 primarily due to an increase
in expenses related to our head office growth of $13.6 million, as well as increased depreciation and amortization
expense of $1.2 million, increased stock-based compensation expense of $1.0 million and increased provision for
impairment and lease exist costs of $1.4 million. The increase was partially offset by increases in realized foreign
exchange gains of $0.3 million. General corporate expenses are expected to continue to increase in future years as we
grow our overall business and require increased efforts at our head office to support our corporate-owned stores,
franchises and other segments.
Our $1.8 million provision for impairment and lease exit costs was a result of management’s review of our
portfolio of corporate-owned store locations and the relocation of our administrative offices. In conjunction with our
ongoing evaluation to ensure that each of our corporate-owned stores fit into our long-term growth strategy, we
closed two of our corporate-owned stores in the fourth quarter of fiscal 2010. We recorded a $0.7 million provision
for impairment and lease exit costs related to the two fiscal 2010 closures, and a $0.9 million provision for
impairment and lease exit costs related to the relocation of our administrative offices. We also closed one of our
corporate-owned stores in the first quarter of fiscal 2009; this closure was fully accrued in fiscal 2008. The fair
market values were estimated using an expected present value technique.
Other Income (Expense), Net
Other income (expense), net increased $2.7 million, to $2.9 million in fiscal 2010 from $0.2 million in fiscal
2009. The increase was primarily a result of re-measuring our 13 percent non-controlling equity investment in
Australia immediately prior to obtaining control of the business, which led to a $1.8 million gain on investment.
37
Fiscal Year Ended January 30, 2011 and
January 31, 2010
2010
2009
2010
2009
(In thousands)
(Percentages)
Corporate
-
owned stores
$
215,154
$
121,614
36.4
30.9
Direct to consumer
16,364
6,288
28.5
34.4
Other
18,004
10,845
28.4
26.3
Income from operations before general corporate expense
$
249,522
$
138,747